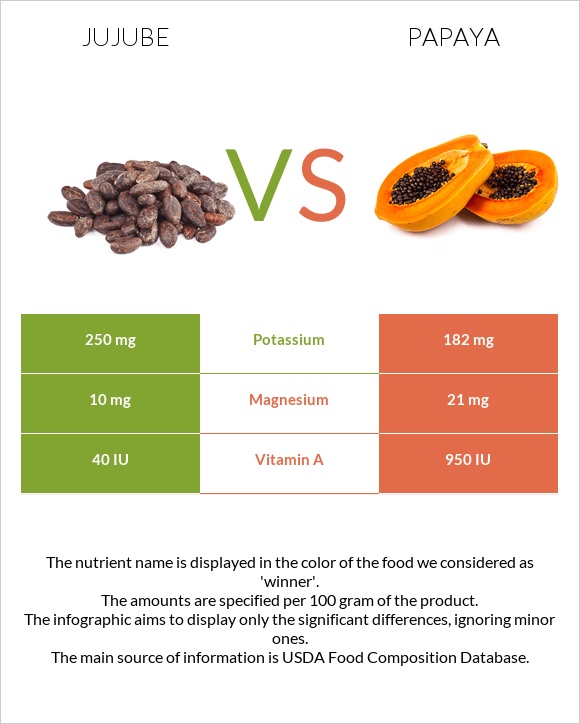
Important differences between jujube and papaya Jujube has more vitamin C; however, papaya has more vitamin A. Papaya's daily need coverage for vitamin A is 18% more. Papaya has a higher glycemic index than jujube. The food varieties used in the comparison are Jujube, raw and Papayas, raw .
Infographic
Mineral Comparison
Mineral comparison score is based on the number of minerals by which one or the other food is richer. The "coverage" charts below show how much of the daily needs can be covered by 300 grams of the food.
6
100 g
300 g
Magnesium
Magnesium
Calcium
Calcium
Potassium
Potassium
Iron
Iron
Copper
Copper
Zinc
Zinc
Phosphorus
Phosphorus
Sodium
Sodium
Manganese
Manganese
Selenium
Selenium
7.1%
6.3%
22%
18%
24%
1.4%
9.9%
0.39%
11%
0%
3
100 g
300 g
1 cup 1" pieces - 145g 1 fruit, small - 157g 1 cup, mashed - 230g 1 fruit, large - 781g
Magnesium
Magnesium
Calcium
Calcium
Potassium
Potassium
Iron
Iron
Copper
Copper
Zinc
Zinc
Phosphorus
Phosphorus
Sodium
Sodium
Manganese
Manganese
Selenium
Selenium
15%
6%
16%
9.4%
15%
2.2%
4.3%
1%
5.2%
3.3%
Vitamin Comparison
Vitamin comparison score is based on the number of vitamins by which one or the other food is richer. The "coverage" charts below show how much of the daily needs can be covered by 300 grams of the food.
4
100 g
300 g
Vitamin C
Vit. C
Vitamin D
Vit. D
Vitamin A
Vit. A
Vitamin E
Vit. E
Vitamin B1
Vit. B1
Vitamin B2
Vit. B2
Vitamin B3
Vit. B3
Vitamin B5
Vit. B5
Vitamin B6
Vit. B6
Vitamin B12
Vit. B12
Vitamin K
Vit. K
Folate
Folate
230%
0%
0.67%
0%
5%
9.2%
17%
0%
19%
0%
0%
0%
6
100 g
300 g
1 cup 1" pieces - 145g 1 fruit, small - 157g 1 cup, mashed - 230g 1 fruit, large - 781g
Vitamin C
Vit. C
Vitamin D
Vit. D
Vitamin A
Vit. A
Vitamin E
Vit. E
Vitamin B1
Vit. B1
Vitamin B2
Vit. B2
Vitamin B3
Vit. B3
Vitamin B5
Vit. B5
Vitamin B6
Vit. B6
Vitamin B12
Vit. B12
Vitamin K
Vit. K
Folate
Folate
203%
0%
16%
6%
5.8%
6.2%
6.7%
11%
8.8%
0%
6.5%
28%
All nutrients comparison - raw data values
Nutrient
DV% diff.
Vitamin C
69mg
60.9mg
9%
Folate
37µg
9%
Fiber
1.7g
7%
Vitamin A
2µg
47µg
5%
Fructose
3.73g
5%
Vitamin B5
0.191mg
4%
Carbs
20.23g
10.82g
3%
Magnesium
10mg
21mg
3%
Iron
0.48mg
0.25mg
3%
Copper
0.073mg
0.045mg
3%
Vitamin B3
0.9mg
0.357mg
3%
Vitamin B6
0.081mg
0.038mg
3%
Calories
79kcal
43kcal
2%
Potassium
250mg
182mg
2%
Phosphorus
23mg
10mg
2%
Vitamin E
0.3mg
2%
Manganese
0.084mg
0.04mg
2%
Vitamin K
2.6µg
2%
Protein
1.2g
0.47g
1%
Selenium
0.6µg
1%
Vitamin B2
0.04mg
0.027mg
1%
Choline
6.1mg
1%
Protein per 100 calories
1.5g
1.1g
N/A
Calories per 10 g protein
658kcal
915kcal
N/A
Weight per 100 calories
127g
233g
N/A
Fats
0.2g
0.26g
0%
Net carbs
20.23g
9.12g
N/A
Calcium
21mg
20mg
0%
Sugar
7.82g
N/A
Zinc
0.05mg
0.08mg
0%
Sodium
3mg
8mg
0%
Vitamin B1
0.02mg
0.023mg
0%
Saturated fat
0.081g
0%
Monounsaturated fat
0.072g
0%
Polyunsaturated fat
0.058g
0%
Tryptophan
0.008mg
0%
Threonine
0.011mg
0%
Isoleucine
0.008mg
0%
Leucine
0.016mg
0%
Lysine
0.025mg
0%
Methionine
0.002mg
0%
Phenylalanine
0.009mg
0%
Valine
0.01mg
0%
Histidine
0.005mg
0%
Macronutrient Comparison
Macronutrient breakdown side-by-side comparison
3
20%
78%
Protein:
1.2 g
Fats:
0.2 g
Carbs:
20.23 g
Water:
77.86 g
Other:
0.51 g
2
11%
88%
Protein:
0.47 g
Fats:
0.26 g
Carbs:
10.82 g
Water:
88.06 g
Other:
0.39 g
Contains
more
Protein Protein
+155.3%
Contains
more
Carbs Carbs
+87%
Contains
more
Other Other
+30.8%
Contains
more
Fats Fats
+30%
Contains
more
Water Water
+13.1%