Jujube vs. Pitanga (Surinam cherry) — In-Depth Nutrition Comparison
Compare
Important differences between jujube and pitanga (Surinam cherry)
- Jujube has more vitamin C; however, pitanga (Surinam cherry) has more vitamin A.
- Jujube's daily need coverage for vitamin C is 47% more.
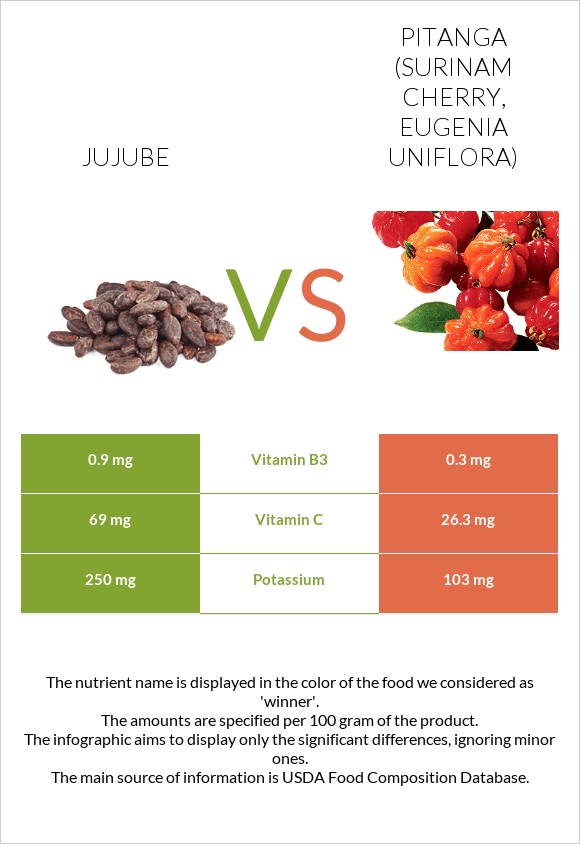
- Jujube has 3 times more vitamin B3 than pitanga (Surinam cherry). Jujube has 0.9mg of vitamin B3, while pitanga (Surinam cherry) has 0.3mg.
The food varieties used in the comparison are Jujube, raw and Pitanga, (surinam-cherry), raw.
Infographic
Infographic link
Mineral Comparison
Mineral comparison score is based on the number of minerals by which one or the other food is richer. The "coverage" charts below show how much of the daily needs can be covered by 300 grams of the food.
| Contains more CalciumCalcium | +133.3% |
| Contains more PotassiumPotassium | +142.7% |
| Contains more IronIron | +140% |
| Contains more CopperCopper | +∞% |
| Contains more ZincZinc | +∞% |
| Contains more PhosphorusPhosphorus | +109.1% |
| Contains more ManganeseManganese | +∞% |
| Contains more MagnesiumMagnesium | +20% |
Vitamin Comparison
Vitamin comparison score is based on the number of vitamins by which one or the other food is richer. The "coverage" charts below show how much of the daily needs can be covered by 300 grams of the food.
| Contains more Vitamin CVitamin C | +162.4% |
| Contains more Vitamin B3Vitamin B3 | +200% |
| Contains more Vitamin B6Vitamin B6 | +∞% |
| Contains more Vitamin AVitamin A | +3650% |
| Contains more Vitamin B1Vitamin B1 | +50% |
All nutrients comparison - raw data values
| Nutrient |  |
 |
DV% diff. |
| Vitamin C | 69mg | 26.3mg | 47% |
| Copper | 0.073mg | 8% | |
| Vitamin A | 2µg | 75µg | 8% |
| Vitamin B6 | 0.081mg | 6% | |
| Carbs | 20.23g | 7.49g | 4% |
| Potassium | 250mg | 103mg | 4% |
| Iron | 0.48mg | 0.2mg | 4% |
| Manganese | 0.084mg | 4% | |
| Vitamin B3 | 0.9mg | 0.3mg | 4% |
| Calories | 79kcal | 33kcal | 2% |
| Phosphorus | 23mg | 11mg | 2% |
| Protein | 1.2g | 0.8g | 1% |
| Calcium | 21mg | 9mg | 1% |
| Vitamin B1 | 0.02mg | 0.03mg | 1% |
| Protein per 100 calories | 1.5g | 2.4g | N/A |
| Calories per 10 g protein | 658kcal | 413kcal | N/A |
| Weight per 100 calories | 127g | 303g | N/A |
| Fats | 0.2g | 0.4g | 0% |
| Net carbs | 20.23g | 7.49g | N/A |
| Magnesium | 10mg | 12mg | 0% |
| Zinc | 0.05mg | 0% | |
| Sodium | 3mg | 3mg | 0% |
| Vitamin B2 | 0.04mg | 0.04mg | 0% |
Macronutrient Comparison
Macronutrient breakdown side-by-side comparison
Protein:
1.2 g
Fats:
0.2 g
Carbs:
20.23 g
Water:
77.86 g
Other:
0.51 g
Protein:
0.8 g
Fats:
0.4 g
Carbs:
7.49 g
Water:
90.81 g
Other:
0.5 g
| Contains more ProteinProtein | +50% |
| Contains more CarbsCarbs | +170.1% |
| Contains more FatsFats | +100% |
| Contains more WaterWater | +16.6% |
~equal in
Other
~0.5g


