Kellogg's Froot Loops vs. Kellogg's Apple Jacks — In-Depth Nutrition Comparison
Compare
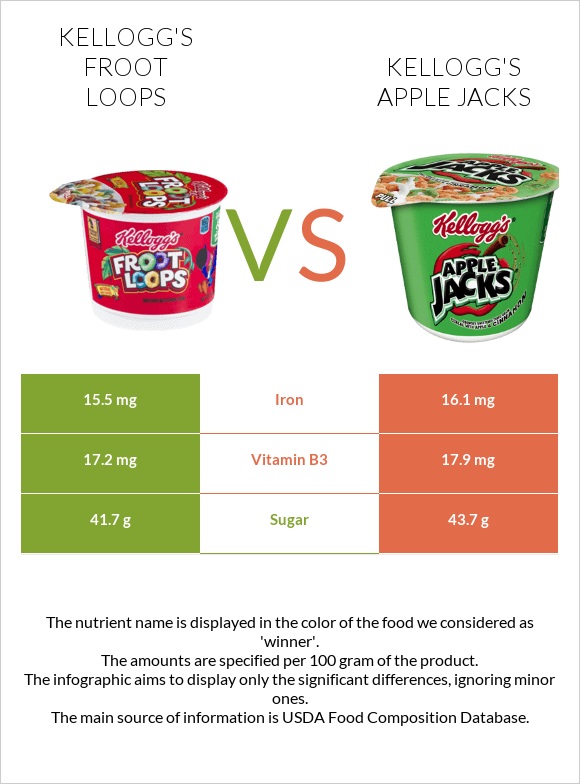
Summary of differences between kellogg's Froot Loops and kellogg's Apple Jacks
- The amount of vitamin B12, iron, and vitamin B6 in kellogg's Apple Jacks is higher than in kellogg's Froot Loops.
- The amount of sugar in kellogg's Froot Loops is lower.
These are the specific foods used in this comparison Cereals ready-to-eat, KELLOGG, KELLOGG'S FROOT LOOPS and Cereals ready-to-eat, KELLOGG, KELLOGG'S APPLE JACKS.
Infographic
Infographic link
Mineral Comparison
Mineral comparison score is based on the number of minerals by which one or the other food is richer. The "coverage" charts below show how much of the daily needs can be covered by 300 grams of the food.
| Contains more ManganeseManganese | +12.2% |
| Contains more CalciumCalcium | +20% |
| Contains more CopperCopper | +10.1% |
Vitamin Comparison
Vitamin comparison score is based on the number of vitamins by which one or the other food is richer. The "coverage" charts below show how much of the daily needs can be covered by 300 grams of the food.
| Contains more Vitamin EVitamin E | +25% |
| Contains more Vitamin KVitamin K | +33.3% |
All nutrients comparison - raw data values
| Nutrient |  |
 |
DV% diff. |
| Iron | 15.5mg | 16.1mg | 8% |
| Vitamin B12 | 5.2µg | 5.4µg | 8% |
| Vitamin B6 | 1.72mg | 1.79mg | 5% |
| Vitamin B1 | 1.29mg | 1.34mg | 4% |
| Vitamin B2 | 1.47mg | 1.52mg | 4% |
| Vitamin B3 | 17.2mg | 17.9mg | 4% |
| Vitamin A | 501µg | 527µg | 3% |
| Manganese | 0.56mg | 0.499mg | 3% |
| Folate | 345µg | 357µg | 3% |
| Vitamin C | 52mg | 54mg | 2% |
| Zinc | 5.2mg | 5.4mg | 2% |
| Vitamin D* | 138 IU | 143 IU | 1% |
| Vitamin D | 3.5µg | 3.6µg | 1% |
| Copper | 0.089mg | 0.098mg | 1% |
| Phosphorus | 74mg | 70mg | 1% |
| Selenium | 5.9µg | 5.6µg | 1% |
| Choline | 10.5mg | 7.5mg | 1% |
| Calories | 375kcal | 375kcal | 0% |
| Protein | 5.3g | 5.1g | 0% |
| Protein per 100 calories | 1.4g | 1.4g | N/A |
| Calories per 10 g protein | 708kcal | 735kcal | N/A |
| Weight per 100 calories | 27g | 27g | N/A |
| Fats | 3.4g | 3.4g | 0% |
| Unsaturated / Saturated Fat ratio | 0.83 | 0.79 | N/A |
| Net carbs | 78.7g | 78.9g | N/A |
| Carbs | 88g | 88.2g | 0% |
| Magnesium | 31mg | 29mg | 0% |
| Calcium | 10mg | 12mg | 0% |
| Potassium | 117mg | 112mg | 0% |
| Sugar | 41.7g | 43.7g | N/A |
| Fiber | 9.3g | 9.3g | 0% |
| Sodium | 469mg | 466mg | 0% |
| Vitamin E | 0.15mg | 0.12mg | 0% |
| Vitamin B5 | 0.347mg | 0.345mg | 0% |
| Vitamin K | 0.3µg | 0.4µg | 0% |
| Saturated fat | 1.8g | 1.9g | 0% |
| Monounsaturated fat | 0.6g | 0.6g | 0% |
| Polyunsaturated fat | 0.9g | 0.9g | 0% |
| Tryptophan | 0.089mg | 0.06mg | 0% |
| Threonine | 0.167mg | 0.18mg | 0% |
| Isoleucine | 0.156mg | 0.192mg | 0% |
| Leucine | 0.435mg | 0.468mg | 0% |
| Lysine | 0.1mg | 0.132mg | 0% |
| Methionine | 0.078mg | 0.084mg | 0% |
| Phenylalanine | 0.245mg | 0.252mg | 0% |
| Valine | 0.201mg | 0.264mg | 0% |
| Histidine | 0.1mg | 0.144mg | 0% |
Macronutrient Comparison
Macronutrient breakdown side-by-side comparison
Protein:
5.3 g
Fats:
3.4 g
Carbs:
88 g
Water:
2.5 g
Other:
0.8 g
Protein:
5.1 g
Fats:
3.4 g
Carbs:
88.2 g
Water:
2.5 g
Other:
0.8 g
~equal in
Protein
~5.1g
~equal in
Fats
~3.4g
~equal in
Carbs
~88.2g
~equal in
Water
~2.5g
~equal in
Other
~0.8g
Fat Type Comparison
Fat type breakdown side-by-side comparison
Saturated fat:
Sat. Fat
1.8 g
Monounsaturated fat:
Mono. Fat
0.6 g
Polyunsaturated fat:
Poly. Fat
0.9 g
Saturated fat:
Sat. Fat
1.9 g
Monounsaturated fat:
Mono. Fat
0.6 g
Polyunsaturated fat:
Poly. Fat
0.9 g
~equal in
Saturated fat
~1.9g
~equal in
Monounsaturated fat
~0.6g
~equal in
Polyunsaturated fat
~0.9g


