Kielbasa vs. Beef Liver — In-Depth Nutrition Comparison
Compare
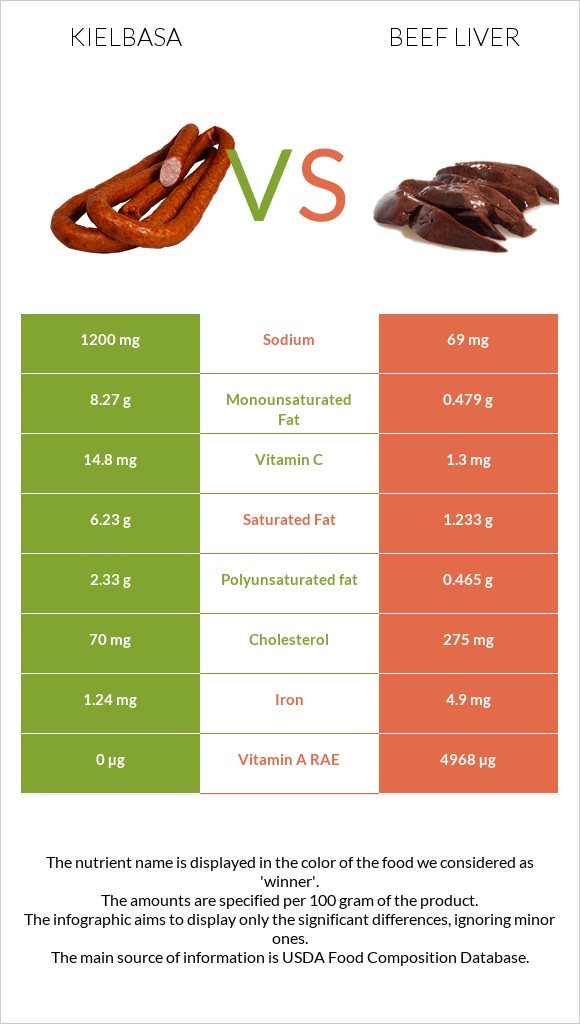
Significant differences between kielbasa and beef Liver
- Kielbasa has more vitamin C, polyunsaturated fat, and monounsaturated fat; however, beef Liver is richer in vitamin A and iron.
- Beef Liver covers your daily vitamin A needs 634% more than kielbasa.
- Beef Liver has 15 times less sodium than kielbasa. Kielbasa has 1200mg of sodium, while beef Liver has 79mg.
Specific food types used in this comparison are Kielbasa, Polish, turkey, and beef, smoked and Beef, variety meats, and by-products, liver, cooked, braised.
Infographic
Infographic link
Mineral Comparison
Mineral comparison score is based on the number of minerals by which one or the other food is richer. The "coverage" charts below show how much of the daily needs can be covered by 300 grams of the food.
| Contains more IronIron | +427.4% |
| Contains less SodiumSodium | -93.4% |
Vitamin Comparison
Vitamin comparison score is based on the number of vitamins by which one or the other food is richer. The "coverage" charts below show how much of the daily needs can be covered by 300 grams of the food.
| Contains more Vitamin CVitamin C | +678.9% |
| Contains more Vitamin AVitamin A | +∞% |
All nutrients comparison - raw data values
| Nutrient |  |
 |
DV% diff. |
| Vitamin B12 | 70.58µg | 2941% | |
| Copper | 14.283mg | 1587% | |
| Vitamin A | 0µg | 9442µg | 1049% |
| Vitamin B2 | 3.425mg | 263% | |
| Vitamin B5 | 7.11mg | 142% | |
| Vitamin B3 | 17.525mg | 110% | |
| Cholesterol | 70mg | 396mg | 109% |
| Vitamin B6 | 1.017mg | 78% | |
| Choline | 426mg | 77% | |
| Phosphorus | 497mg | 71% | |
| Iron | 1.24mg | 6.54mg | 66% |
| Selenium | 36.1µg | 66% | |
| Folate | 253µg | 63% | |
| Sodium | 1200mg | 79mg | 49% |
| Zinc | 5.3mg | 48% | |
| Protein | 13.1g | 29.08g | 32% |
| Fats | 17.6g | 5.26g | 19% |
| Monounsaturated fat | 8.27g | 1.124g | 18% |
| Vitamin B1 | 0.194mg | 16% | |
| Manganese | 0.356mg | 15% | |
| Saturated fat | 6.23g | 2.947g | 15% |
| Vitamin C | 14.8mg | 1.9mg | 14% |
| Potassium | 352mg | 10% | |
| Polyunsaturated fat | 2.33g | 1.109g | 8% |
| Vitamin D | 49 IU | 6% | |
| Vitamin D | 1.2µg | 6% | |
| Magnesium | 21mg | 5% | |
| Vitamin E | 0.51mg | 3% | |
| Vitamin K | 3.3µg | 3% | |
| Calories | 226kcal | 191kcal | 2% |
| Calcium | 6mg | 1% | |
| Net carbs | 3.9g | 5.13g | N/A |
| Carbs | 3.9g | 5.13g | 0% |
| Trans fat | 0.365g | N/A | |
| Tryptophan | 0.368mg | 0% | |
| Threonine | 1.215mg | 0% | |
| Isoleucine | 1.352mg | 0% | |
| Leucine | 2.67mg | 0% | |
| Lysine | 2.247mg | 0% | |
| Methionine | 0.759mg | 0% | |
| Phenylalanine | 1.515mg | 0% | |
| Valine | 1.761mg | 0% | |
| Histidine | 0.879mg | 0% | |
| Omega-3 - ALA | 0.017g | N/A | |
| Omega-6 - Gamma-linoleic acid | 0.025g | N/A | |
| Omega-6 - Eicosadienoic acid | 0.011g | N/A | |
| Omega-6 - Linoleic acid | 0.659g | N/A |
Macronutrient Comparison
Macronutrient breakdown side-by-side comparison
Protein:
13.1 g
Fats:
17.6 g
Carbs:
3.9 g
Water:
62 g
Other:
3.4 g
Protein:
29.08 g
Fats:
5.26 g
Carbs:
5.13 g
Water:
58.81 g
Other:
1.72 g
| Contains more FatsFats | +234.6% |
| Contains more OtherOther | +97.7% |
| Contains more ProteinProtein | +122% |
| Contains more CarbsCarbs | +31.5% |
~equal in
Water
~58.81g
Fat Type Comparison
Fat type breakdown side-by-side comparison
Saturated fat:
Sat. Fat
6.23 g
Monounsaturated fat:
Mono. Fat
8.27 g
Polyunsaturated fat:
Poly. Fat
2.33 g
Saturated fat:
Sat. Fat
2.947 g
Monounsaturated fat:
Mono. Fat
1.124 g
Polyunsaturated fat:
Poly. Fat
1.109 g
| Contains more Mono. FatMonounsaturated fat | +635.8% |
| Contains more Poly. FatPolyunsaturated fat | +110.1% |
| Contains less Sat. FatSaturated fat | -52.7% |


