Beef Liver nutrition: calories, carbs, GI, protein, fiber, fats
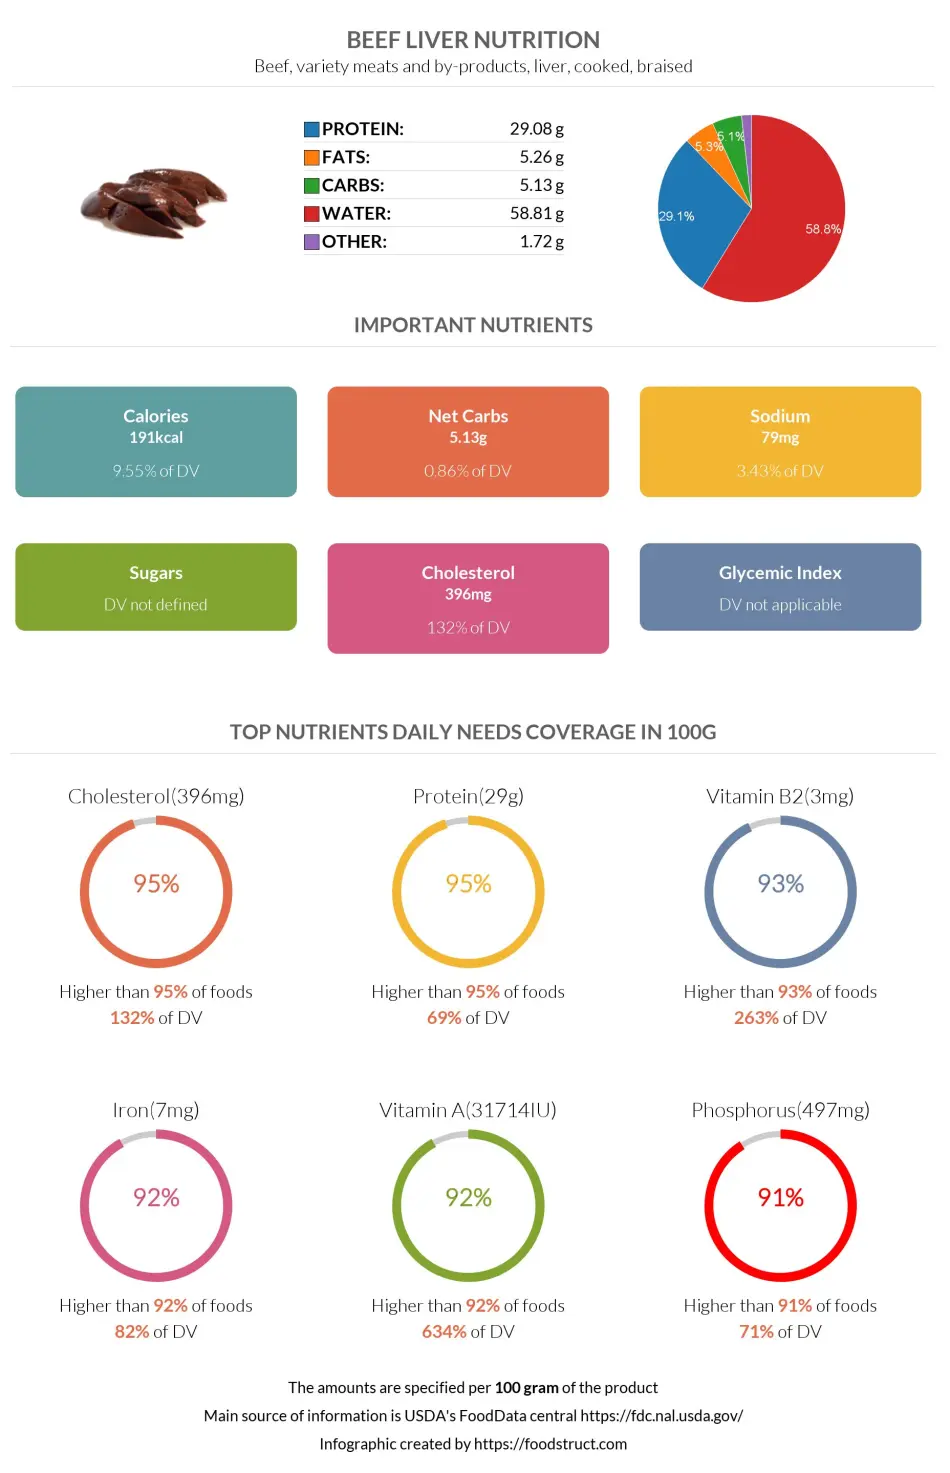
Beef, variety meats and by-products, liver, cooked, braised
*all the values are displayed for the amount of 100 grams
Top nutrition facts for Beef Liver
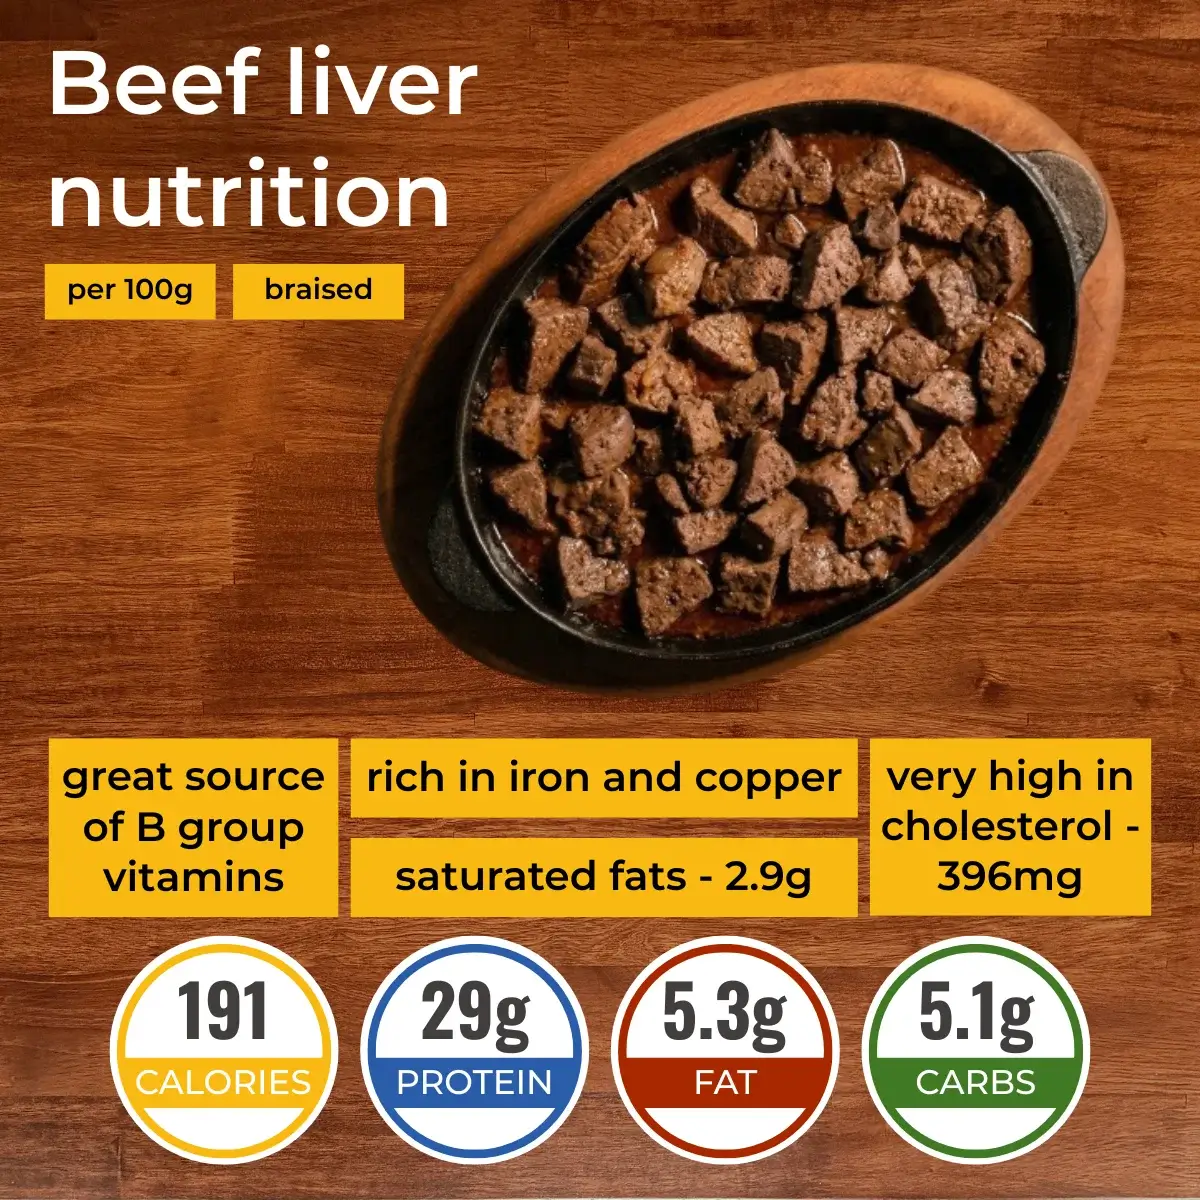
| Calories ⓘ Calories for selected serving | 191 kcal |
| Protein | 29.08 g |
| Cholesterol | 396 mg |
| Vitamin B12 | 70.58 µg |
| Iron | 6.54 mg |
| Insulin index ⓘ The insulin index of foods demonstrates how much a food increases the insulin level in the blood, in the first two-hour period after consumption. | 37 ⓘ https://pubmed.ncbi.nlm.nih.gov/32414656/ - The insulin index for cow organ meat - 37 |
Vitamin B2 ⓘHigher in Vitamin B2 content than 99% of foods
Choline ⓘHigher in Choline content than 99% of foods
Vitamin B12 ⓘHigher in Vitamin B12 content than 99% of foods
Vitamin A ⓘHigher in Vitamin A content than 99% of foods
Copper ⓘHigher in Copper content than 99% of foods
Beef Liver calories (kcal)
| Calories for different serving sizes of beef Liver | Calories | Weight |
|---|---|---|
| Calories in 100 grams | 191 | |
| Calories in 1 slice | 130 | 68 g |
| Calories for different varieties of beef Liver | Calories | Weight |
|---|---|---|
| Beef, variety meats and by-products, liver, cooked, braised (this food) | 191 | 100 g |
| Beef, variety meats and by-products, lungs, raw | 92 | 100 g |
| Beef, variety meats and by-products, spleen, raw | 105 | 100 g |
| Beef, variety meats and by-products, lungs, cooked, braised | 120 | 100 g |
| Beef Liver raw | 135 | 100 g |
| Beef, variety meats and by-products, spleen, cooked, braised | 145 | 100 g |
| Beef, variety meats and by-products, pancreas, raw | 235 | 100 g |
| Beef, variety meats and by-products, thymus, raw | 236 | 100 g |
| Beef, variety meats and by-products, pancreas, cooked, braised | 271 | 100 g |
| Beef, variety meats and by-products, mechanically separated beef, raw | 276 | 100 g |
| Beef, variety meats and by-products, thymus, cooked, braised | 319 | 100 g |
| Beef, variety meats and by-products, suet, raw | 854 | 100 g |
Extra Nutrition facts for Beef Liver
| Protein per 100 calories ⓘ Shows how many grams of protein you get from 100 calories of this food, calculated as (protein in g ÷ calories) × 100. | 15 g |
| Calories per 10 g protein ⓘ Shows how many calories you need to eat from this food to get 10 g of protein, calculated as (calories ÷ protein in g) × 10. | 66 kcal |
| Weight per 100 calories ⓘ Shows how many grams of this food equal 100 kcal—higher grams mean a larger portion for the same calories. | 52 g |
| Unsaturated / Saturated Fat ratio ⓘ (monounsaturated + polyunsaturated) / saturated, ≥2 broadly recommended by major guidelines for heart health | 0.76 |
| Acidity (Based on PRAL) ⓘ PRAL (Potential renal acid load) is calculated using a formula. On the PRAL scale the higher the positive value, the more is the acidifying effect on the body. The lower the negative value, the higher the alkalinity of the food. 0 is neutral. | 24.6 (acidic) |
| Processing score ⓘ The processing score is a calculated value that looks at both how industrially made it is (NOVA) and how healthy/unprocessed the ingredients are (SIGA), then combines them into one score from 1 (least processed) to 4 (most processed). | 1.7 - Minimally processed ⓘ (Cooked, fried) NOVA score = 2, SIGA score = A1 |
Mineral coverage chart
Mineral chart - relative view
Vitamin coverage chart
Vitamin A:
28326µg of 900µg
3147%
Vitamin E:
1.5mg of 15mg
10%
Vitamin D:
3.6µg of 20µg
18%
Vitamin C:
5.7mg of 90mg
6.3%
Vitamin B1:
0.58mg of 1mg
49%
Vitamin B2:
10mg of 1mg
790%
Vitamin B3:
53mg of 16mg
329%
Vitamin B5:
21mg of 5mg
427%
Vitamin B6:
3.1mg of 1mg
235%
Folate:
759µg of 400µg
190%
Vitamin B12:
212µg of 2µg
8823%
Vitamin K:
9.9µg of 120µg
8.3%
Vitamin chart - relative view
Macronutrients chart
Protein:
Daily Value: 58%
29.1 g of 50 g
29.1 g (58% of DV )
Fats:
Daily Value: 8%
5.3 g of 65 g
5.3 g (8% of DV )
Carbs:
Daily Value: 2%
5.1 g of 300 g
5.1 g (2% of DV )
Water:
Daily Value: 3%
58.8 g of 2,000 g
58.8 g (3% of DV )
Other:
1.7 g
1.7 g
Protein quality breakdown
Tryptophan:
1104mg of 280mg
394%
Threonine:
3645mg of 1,050mg
347%
Isoleucine:
4056mg of 1,400mg
290%
Leucine:
8010mg of 2,730mg
293%
Lysine:
6741mg of 2,100mg
321%
Methionine:
2277mg of 1,050mg
217%
Phenylalanine:
4545mg of 1,750mg
260%
Valine:
5283mg of 1,820mg
290%
Histidine:
2637mg of 700mg
377%
Fat type information
Saturated fat:
2.9 g
Monounsaturated fat:
1.1 g
Polyunsaturated fat:
1.1 g
All nutrients for Beef Liver per 100g
| Nutrient | Value | DV% | In TOP % of foods | Comparison |
| Vitamin A | 9442µg | 1049% | 1% | |
| Calories | 191kcal | 10% | 51% |
4.1 times more than Orange
|
| Protein per 100 calories | 15g | N/A | 12% | |
| Calories per 10 g protein | 66kcal | N/A | 85% | |
| Weight per 100 calories | 52g | N/A | 50% | |
| Protein | 29g | 69% | 6% |
10.3 times more than Broccoli
|
| Unsaturated / Saturated Fat ratio | 0.76 | N/A | 81% | |
| Fats | 5.3g | 8% | 50% |
6.3 times less than Cheese
|
| Vitamin C | 1.9mg | 2% | 28% |
27.9 times less than Lemon
|
| Net carbs | 5.1g | N/A | 57% |
10.6 times less than Chocolate
|
| Carbs | 5.1g | 2% | 60% |
5.5 times less than Rice
|
| Cholesterol | 396mg | 132% | 1% |
1.1 times more than Egg
|
| Vitamin D | 1.2µg | 6% | 6% |
1.8 times less than Egg
|
| Vitamin D* | 49 IU | 6% | 6% |
1.8 times less than Egg
|
| Magnesium | 21mg | 5% | 49% |
6.7 times less than Almonds
|
| Calcium | 6mg | 1% | 85% |
20.8 times less than Milk
|
| Potassium | 352mg | 10% | 21% |
2.4 times more than Cucumber
|
| Iron | 6.5mg | 82% | 7% |
2.5 times more than Beef broiled
|
| Sugar | 0g | N/A | 100% |
N/A
|
| Fiber | 0g | 0% | 100% |
N/A
|
| Copper | 14mg | 1587% | 1% |
100.6 times more than Shiitake
|
| Zinc | 5.3mg | 48% | 9% |
1.2 times less than Beef broiled
|
| Phosphorus | 497mg | 71% | 3% |
2.7 times more than Chicken meat
|
| Sodium | 79mg | 3% | 53% |
6.2 times less than White bread
|
| Vitamin E | 0.51mg | 3% | 24% |
2.9 times less than Kiwi
|
| Manganese | 0.36mg | 15% | 18% | |
| Selenium | 36µg | 66% | 8% | |
| Vitamin B1 | 0.19mg | 16% | 28% |
1.4 times less than Pea raw
|
| Vitamin B2 | 3.4mg | 263% | 1% |
26.3 times more than Avocado
|
| Vitamin B3 | 18mg | 110% | 2% |
1.8 times more than Turkey meat
|
| Vitamin B5 | 7.1mg | 142% | 1% |
6.3 times more than Sunflower seeds
|
| Vitamin B6 | 1mg | 78% | 4% |
8.5 times more than Oats
|
| Vitamin B12 | 71µg | 2941% | 1% |
100.8 times more than Pork
|
| Vitamin K | 3.3µg | 3% | 20% |
30.8 times less than Broccoli
|
| Trans fat | 0.37g | N/A | 9% |
40.8 times less than Margarine
|
| Folate | 253µg | 63% | 4% |
4.1 times more than Brussels sprouts
|
| Saturated fat | 2.9g | 15% | 34% |
2 times less than Beef broiled
|
| Choline | 426mg | 77% | 1% | |
| Monounsaturated fat | 1.1g | N/A | 56% |
8.7 times less than Avocado
|
| Polyunsaturated fat | 1.1g | N/A | 36% |
42.5 times less than Walnut
|
| Tryptophan | 0.37mg | 0% | 3% |
1.2 times more than Chicken meat
|
| Threonine | 1.2mg | 0% | 7% |
1.7 times more than Beef broiled
|
| Isoleucine | 1.4mg | 0% | 6% |
1.5 times more than Salmon raw
|
| Leucine | 2.7mg | 0% | 2% |
1.1 times more than Tuna Bluefin
|
| Lysine | 2.2mg | 0% | 11% |
5 times more than Tofu
|
| Methionine | 0.76mg | 0% | 7% |
7.9 times more than Quinoa
|
| Phenylalanine | 1.5mg | 0% | 1% |
2.3 times more than Egg
|
| Valine | 1.8mg | 0% | 2% |
1.2 times less than Soybean raw
|
| Histidine | 0.88mg | 0% | 10% |
1.2 times more than Turkey meat
|
| Caffeine | 0mg | 0% | 100% | |
| Omega-3 - EPA | 0g | N/A | 100% |
N/A
|
| Omega-3 - DHA | 0g | N/A | 100% |
N/A
|
| Omega-3 - ALA | 0.02g | N/A | 18% |
537.6 times less than Canola oil
|
| Omega-3 - DPA | 0g | N/A | 100% |
N/A
|
| Omega-6 - Gamma-linoleic acid | 0.03g | N/A | 2% | |
| Omega-6 - Eicosadienoic acid | 0.01g | N/A | 7% | |
| Omega-6 - Linoleic acid | 0.66g | N/A | 10% |
18.7 times less than Almonds
|
Check out similar food or compare with current
NUTRITION FACTS LABEL
Nutrition Facts
___servings per container
Serving Size ______________
Serving Size ______________
Amount Per 100g
Calories 191
% Daily Value*
8.1%
Total Fat
5.3g
13%
Saturated Fat 2.9g
0
Trans Fat
0g
132%
Cholesterol 396mg
3.4%
Sodium 79mg
1.7%
Total Carbohydrate
5.1g
0
Dietary Fiber
0g
Total Sugars 0g
Includes ? g Added Sugars
Protein
29g
Vitamin D
49mcg
6.1%
Calcium
6mg
0.6%
Iron
6.5mg
82%
Potassium
352mg
10%
*
The % Daily Value (DV) tells you how much a nutrient in a serving of food contributes to a daily diet. 2,000 calories a day is used for general nutrition advice.
Health checks
ⓘ
Dietary cholesterol is not associated with an increased risk of coronary heart disease in healthy individuals. However, dietary cholesterol is common in foods that are high in harmful saturated fats.
Source
Low in Cholesterol
ⓘ
Trans fat consumption increases the risk of cardiovascular disease and mortality by negatively affecting blood lipid levels.
Source
No Trans Fats
ⓘ
Saturated fat intake can raise total cholesterol and LDL (low-density lipoprotein) levels, leading to an increased risk of atherosclerosis. Dietary guidelines recommend limiting saturated fats to under 10% of calories a day.
Source
Low in Saturated Fats
ⓘ
While the consumption of moderate amounts of added sugars is not detrimental to health, an excessive intake can increase the risk of obesity, and therefore, diabetes.
Source
Low in Sugars
Beef Liver nutrition infographic
Infographic link
References
All the values for which the sources are not specified explicitly are taken from FDA’s Food Central. The exact link to the food presented on this page can be found below.