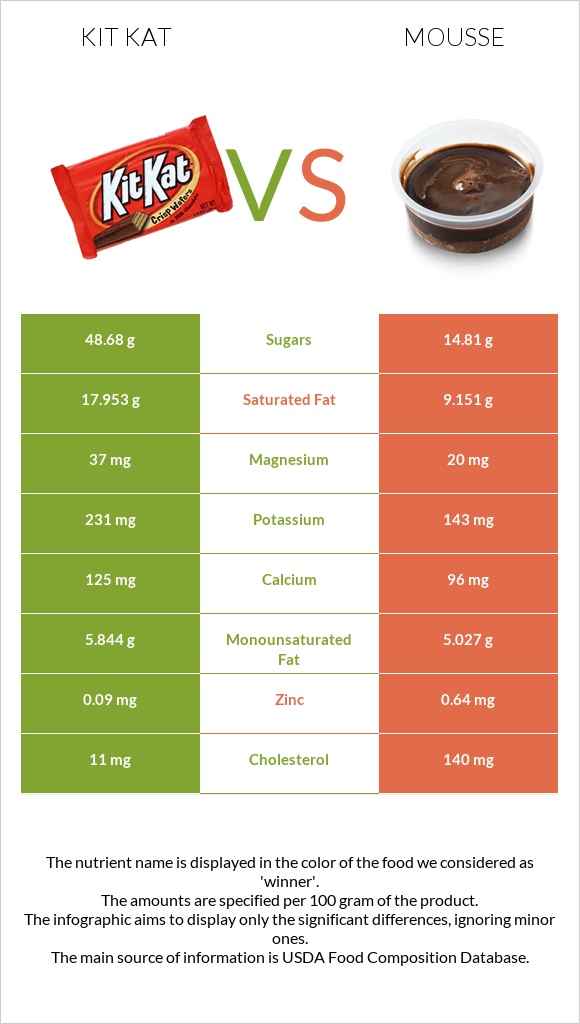
Differences between kit Kat and mousse Kit Kat has more copper, vitamin B1, and iron, while mousse has more vitamin A. Kit Kat's daily need coverage for saturated fat is 44% higher. Mousse contains 3 times less copper than kit Kat. Kit Kat contains 0.22mg of copper, while mousse contains 0.075mg. The amount of saturated fat in mousse is lower. The food types used in this comparison are Candies, KIT KAT Wafer Bar and Desserts, mousse, chocolate, prepared-from-recipe .
Infographic
Mineral Comparison
Mineral comparison score is based on the number of minerals by which one or the other food is richer. The "coverage" charts below show how much of the daily needs can be covered by 300 grams of the food.
7
100 g
300 g
1 bar, miniature (.35 oz) - 10g 1 bar (1.5 oz) - 42g 1 bar (1.625 oz) - 46g 1 bar (2.8 oz) - 78g 1 bar (3.375 oz) - 96g
Magnesium
Magnesium
Calcium
Calcium
Potassium
Potassium
Iron
Iron
Copper
Copper
Zinc
Zinc
Phosphorus
Phosphorus
Sodium
Sodium
Manganese
Manganese
Selenium
Selenium
26%
38%
20%
38%
73%
2.5%
58%
7%
13%
27%
3
100 g
300 g
0.5 cup - 202g 1 recipe yield - 808g
Magnesium
Magnesium
Calcium
Calcium
Potassium
Potassium
Iron
Iron
Copper
Copper
Zinc
Zinc
Phosphorus
Phosphorus
Sodium
Sodium
Manganese
Manganese
Selenium
Selenium
14%
29%
13%
21%
25%
17%
50%
5%
7.7%
40%
Vitamin Comparison
Vitamin comparison score is based on the number of vitamins by which one or the other food is richer. The "coverage" charts below show how much of the daily needs can be covered by 300 grams of the food.
5
100 g
300 g
1 bar, miniature (.35 oz) - 10g 1 bar (1.5 oz) - 42g 1 bar (1.625 oz) - 46g 1 bar (2.8 oz) - 78g 1 bar (3.375 oz) - 96g
Vitamin C
Vit. C
Vitamin D
Vit. D
Vitamin A
Vit. A
Vitamin E
Vit. E
Vitamin B1
Vit. B1
Vitamin B2
Vit. B2
Vitamin B3
Vit. B3
Vitamin B5
Vit. B5
Vitamin B6
Vit. B6
Vitamin B12
Vit. B12
Vitamin K
Vit. K
Folate
Folate
0%
0%
8%
6.8%
29%
48%
9.4%
38%
4.6%
70%
13%
11%
4
100 g
300 g
0.5 cup - 202g 1 recipe yield - 808g
Vitamin C
Vit. C
Vitamin D
Vit. D
Vitamin A
Vit. A
Vitamin E
Vit. E
Vitamin B1
Vit. B1
Vitamin B2
Vit. B2
Vitamin B3
Vit. B3
Vitamin B5
Vit. B5
Vitamin B6
Vit. B6
Vitamin B12
Vit. B12
Vitamin K
Vit. K
Folate
Folate
0.33%
0%
47%
10%
11%
47%
2.7%
32%
13%
59%
4%
11%
All nutrients comparison - raw data values
Nutrient
DV% diff.
Cholesterol
11mg
140mg
43%
Saturated fat
17.953g
9.151g
40%
Carbs
64.59g
16.07g
16%
Copper
0.22mg
0.075mg
16%
Calories
518kcal
225kcal
15%
Fats
25.99g
16g
15%
Vitamin A
24µg
140µg
13%
Iron
1mg
0.55mg
6%
Vitamin B1
0.117mg
0.045mg
6%
Choline
31mg
6%
Protein
6.51g
4.14g
5%
Zinc
0.09mg
0.64mg
5%
Magnesium
37mg
20mg
4%
Starch
10.6g
4%
Selenium
5µg
7.4µg
4%
Vitamin B12
0.56µg
0.47µg
4%
Calcium
125mg
96mg
3%
Potassium
231mg
143mg
3%
Phosphorus
135mg
117mg
3%
Vitamin B6
0.02mg
0.058mg
3%
Vitamin K
5.2µg
1.6µg
3%
Fiber
1g
0.6g
2%
Manganese
0.1mg
0.059mg
2%
Vitamin B3
0.5mg
0.146mg
2%
Vitamin B5
0.64mg
0.533mg
2%
Monounsaturated fat
5.844g
5.027g
2%
Caffeine
14mg
7mg
2%
Sodium
54mg
38mg
1%
Vitamin E
0.34mg
0.51mg
1%
Protein per 100 calories
1.3g
1.8g
N/A
Calories per 10 g protein
796kcal
543kcal
N/A
Weight per 100 calories
19g
44g
N/A
Unsaturated / Saturated Fat ratio
0.38
0.65
N/A
Vitamin C
0mg
0.1mg
0%
Net carbs
63.59g
15.47g
N/A
Sugar
48.68g
14.81g
N/A
Vitamin B2
0.21mg
0.205mg
0%
Folate
14µg
15µg
0%
Trans fat
0.099g
N/A
Polyunsaturated fat
0.895g
0.879g
0%
Tryptophan
0.09mg
0%
Threonine
0.19mg
0%
Isoleucine
0.28mg
0%
Leucine
0.52mg
0%
Lysine
0.28mg
0%
Methionine
0.16mg
0%
Phenylalanine
0.27mg
0%
Valine
0.36mg
0%
Histidine
0.11mg
0%
Fructose
0.2g
0%
Omega-3 - EPA
0g
0.001g
N/A
Omega-3 - DHA
0g
0.01g
N/A
Omega-3 - ALA
0.075g
N/A
Macronutrient Comparison
Macronutrient breakdown side-by-side comparison
4
7%
26%
65%
Protein:
6.51 g
Fats:
25.99 g
Carbs:
64.59 g
Water:
1.63 g
Other:
1.28 g
1
4%
16%
16%
63%
Protein:
4.14 g
Fats:
16 g
Carbs:
16.07 g
Water:
62.94 g
Other:
0.85 g
Contains
more
Protein Protein
+57.2%
Contains
more
Fats Fats
+62.4%
Contains
more
Carbs Carbs
+301.9%
Contains
more
Other Other
+50.6%
Contains
more
Water Water
+3761.3%
Fat Type Comparison
Fat type breakdown side-by-side comparison
2
73%
24%
4%
Saturated fat:
Sat. Fat
17.953 g
Monounsaturated fat:
Mono. Fat
5.844 g
Polyunsaturated fat:
Poly. Fat
0.895 g
1
61%
33%
6%
Saturated fat:
Sat. Fat
9.151 g
Monounsaturated fat:
Mono. Fat
5.027 g
Polyunsaturated fat:
Poly. Fat
0.879 g
Contains
more
Mono. Fat Monounsaturated fat
+16.3%
Contains
less
Sat. Fat Saturated fat
-49%
~equal in
Polyunsaturated fat
~0.879g