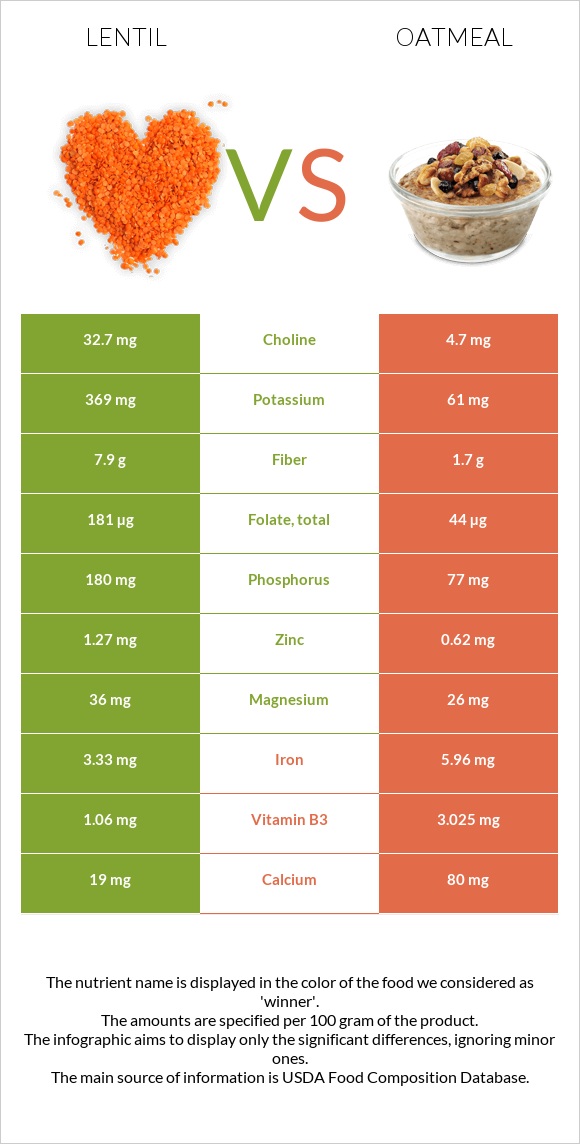
Summary of differences between lentil and oatmeal Lentil has more folate, fiber, copper, phosphorus, and potassium, while oatmeal has more iron, vitamin B3, vitamin B2, vitamin B6, and vitamin A. Lentil covers your daily need for folate, 34% more than oatmeal. Lentil contains 6 times more potassium than oatmeal. While lentil contains 369mg of potassium, oatmeal contains only 61mg. Lentil has a lower glycemic index. The glycemic index of lentil is 29, while the glycemic index of oatmeal is 79. These are the specific foods used in this comparison Lentils, mature seeds, cooked, boiled, without salt and Cereals, oats, instant, fortified, plain, prepared with water (boiling water added or microwaved) .
Infographic
Mineral Comparison
Mineral comparison score is based on the number of minerals by which one or the other food is richer. The "coverage" charts below show how much of the daily needs can be covered by 300 grams of the food.
6
100 g
300 g
1 tbsp - 12.3g 1 cup - 198g
Magnesium
Magnesium
Calcium
Calcium
Potassium
Potassium
Iron
Iron
Copper
Copper
Zinc
Zinc
Phosphorus
Phosphorus
Sodium
Sodium
Manganese
Manganese
Selenium
Selenium
26%
5.7%
33%
125%
84%
35%
77%
0.26%
64%
15%
4
100 g
300 g
1 oz, dry, yields - 177g 1 packet, dry, yields - 177g 1 cup, cooked - 234g 1 cup, dry, yields - 501g
Magnesium
Magnesium
Calcium
Calcium
Potassium
Potassium
Iron
Iron
Copper
Copper
Zinc
Zinc
Phosphorus
Phosphorus
Sodium
Sodium
Manganese
Manganese
Selenium
Selenium
19%
24%
5.4%
224%
22%
17%
33%
6.4%
73%
27%
Vitamin Comparison
Vitamin comparison score is based on the number of vitamins by which one or the other food is richer. The "coverage" charts below show how much of the daily needs can be covered by 300 grams of the food.
5
100 g
300 g
1 tbsp - 12.3g 1 cup - 198g
Vitamin C
Vit. C
Vitamin D
Vit. D
Vitamin A
Vit. A
Vitamin E
Vit. E
Vitamin B1
Vit. B1
Vitamin B2
Vit. B2
Vitamin B3
Vit. B3
Vitamin B5
Vit. B5
Vitamin B6
Vit. B6
Vitamin B12
Vit. B12
Vitamin K
Vit. K
Folate
Folate
5%
0%
0%
2.2%
42%
17%
20%
38%
41%
0%
4.3%
136%
5
100 g
300 g
1 oz, dry, yields - 177g 1 packet, dry, yields - 177g 1 cup, cooked - 234g 1 cup, dry, yields - 501g
Vitamin C
Vit. C
Vitamin D
Vit. D
Vitamin A
Vit. A
Vitamin E
Vit. E
Vitamin B1
Vit. B1
Vitamin B2
Vit. B2
Vitamin B3
Vit. B3
Vitamin B5
Vit. B5
Vitamin B6
Vit. B6
Vitamin B12
Vit. B12
Vitamin K
Vit. K
Folate
Folate
0%
0%
43%
1.4%
65%
50%
57%
19%
67%
0%
1%
33%
All nutrients comparison - raw data values
Nutrient
DV% diff.
Folate
181µg
44µg
34%
Iron
3.33mg
5.96mg
33%
Fiber
7.9g
1.7g
25%
Copper
0.251mg
0.066mg
21%
Phosphorus
180mg
77mg
15%
Vitamin A
0µg
130µg
14%
Protein
9.02g
2.37g
13%
Vitamin B3
1.06mg
3.025mg
12%
Vitamin B2
0.073mg
0.215mg
11%
Potassium
369mg
61mg
9%
Vitamin B6
0.178mg
0.29mg
9%
Vitamin B1
0.169mg
0.26mg
8%
Calcium
19mg
80mg
6%
Zinc
1.27mg
0.62mg
6%
Vitamin B5
0.638mg
0.317mg
6%
Choline
32.7mg
4.7mg
5%
Starch
10.37g
4%
Selenium
2.8µg
5µg
4%
Carbs
20.13g
11.67g
3%
Manganese
0.494mg
0.558mg
3%
Calories
116kcal
68kcal
2%
Fats
0.38g
1.36g
2%
Vitamin C
1.5mg
0mg
2%
Magnesium
36mg
26mg
2%
Sodium
2mg
49mg
2%
Polyunsaturated fat
0.175g
0.426g
2%
Vitamin K
1.7µg
0.4µg
1%
Saturated fat
0.053g
0.226g
1%
Monounsaturated fat
0.064g
0.391g
1%
Protein per 100 calories
7.8g
3.5g
N/A
Calories per 10 g protein
129kcal
287kcal
N/A
Weight per 100 calories
86g
147g
N/A
Net carbs
12.23g
9.97g
N/A
Sugar
1.8g
0.46g
N/A
Vitamin E
0.11mg
0.07mg
0%
Trans fat
0g
0.003g
N/A
Tryptophan
0.081mg
0.04mg
0%
Threonine
0.323mg
0.083mg
0%
Isoleucine
0.39mg
0.105mg
0%
Leucine
0.654mg
0.2mg
0%
Lysine
0.63mg
0.135mg
0%
Methionine
0.077mg
0.04mg
0%
Phenylalanine
0.445mg
0.13mg
0%
Valine
0.448mg
0.151mg
0%
Histidine
0.254mg
0.057mg
0%
Macronutrient Comparison
Macronutrient breakdown side-by-side comparison
3
9%
20%
70%
Protein:
9.02 g
Fats:
0.38 g
Carbs:
20.13 g
Water:
69.64 g
Other:
0.83 g
2
2%
12%
84%
Protein:
2.37 g
Fats:
1.36 g
Carbs:
11.67 g
Water:
84.03 g
Other:
0.57 g
Contains
more
Protein Protein
+280.6%
Contains
more
Carbs Carbs
+72.5%
Contains
more
Other Other
+45.6%
Contains
more
Fats Fats
+257.9%
Contains
more
Water Water
+20.7%
Fat Type Comparison
Fat type breakdown side-by-side comparison
1
18%
22%
60%
Saturated fat:
Sat. Fat
0.053 g
Monounsaturated fat:
Mono. Fat
0.064 g
Polyunsaturated fat:
Poly. Fat
0.175 g
2
22%
37%
41%
Saturated fat:
Sat. Fat
0.226 g
Monounsaturated fat:
Mono. Fat
0.391 g
Polyunsaturated fat:
Poly. Fat
0.426 g
Contains
less
Sat. Fat Saturated fat
-76.5%
Contains
more
Mono. Fat Monounsaturated fat
+510.9%
Contains
more
Poly. Fat Polyunsaturated fat
+143.4%