Summary of differences between Limburger and feta Limburger has more vitamin A, phosphorus, and folate; however, feta is higher in vitamin B12, vitamin B2, vitamin B6, zinc, iron, and vitamin B1. Feta covers your daily need for vitamin B12, 27% more than Limburger. Limburger has 3 times more vitamin A than feta. While Limburger has 1155 IU of vitamin A, feta has only 422 IU. Feta has less saturated fat. These are the specific foods used in this comparison Cheese, limburger and Cheese, feta .
Infographic
Mineral Comparison
Mineral comparison score is based on the number of minerals by which one or the other food is richer. The "coverage" charts below show how much of the daily needs can be covered by 300 grams of the food.
4
100 g
300 g
1 cubic inch - 18g 1 oz - 28.35g 1 box - 113g 1 cup - 134g 1 package (8 oz) - 227g
Magnesium
Magnesium
Calcium
Calcium
Potassium
Potassium
Iron
Iron
Copper
Copper
Zinc
Zinc
Phosphorus
Phosphorus
Sodium
Sodium
Manganese
Manganese
Selenium
Selenium
15%
149%
11%
4.9%
7%
57%
168%
104%
5%
79%
3
100 g
300 g
1 cubic inch - 17g 1 oz - 28.35g 1 wedge (1.33 oz) - 38g 1 cup, crumbled - 150g
Magnesium
Magnesium
Calcium
Calcium
Potassium
Potassium
Iron
Iron
Copper
Copper
Zinc
Zinc
Phosphorus
Phosphorus
Sodium
Sodium
Manganese
Manganese
Selenium
Selenium
14%
148%
5.5%
24%
11%
79%
144%
120%
3.7%
82%
Vitamin Comparison
Vitamin comparison score is based on the number of vitamins by which one or the other food is richer. The "coverage" charts below show how much of the daily needs can be covered by 300 grams of the food.
6
100 g
300 g
1 cubic inch - 18g 1 oz - 28.35g 1 box - 113g 1 cup - 134g 1 package (8 oz) - 227g
Vitamin C
Vit. C
Vitamin D
Vit. D
Vitamin A
Vit. A
Vitamin E
Vit. E
Vitamin B1
Vit. B1
Vitamin B2
Vit. B2
Vitamin B3
Vit. B3
Vitamin B5
Vit. B5
Vitamin B6
Vit. B6
Vitamin B12
Vit. B12
Vitamin K
Vit. K
Folate
Folate
0%
7.5%
113%
4.6%
20%
116%
3%
71%
20%
130%
5.8%
44%
5
100 g
300 g
1 cubic inch - 17g 1 oz - 28.35g 1 wedge (1.33 oz) - 38g 1 cup, crumbled - 150g
Vitamin C
Vit. C
Vitamin D
Vit. D
Vitamin A
Vit. A
Vitamin E
Vit. E
Vitamin B1
Vit. B1
Vitamin B2
Vit. B2
Vitamin B3
Vit. B3
Vitamin B5
Vit. B5
Vitamin B6
Vit. B6
Vitamin B12
Vit. B12
Vitamin K
Vit. K
Folate
Folate
0%
6%
42%
3.6%
39%
195%
19%
58%
98%
211%
4.5%
24%
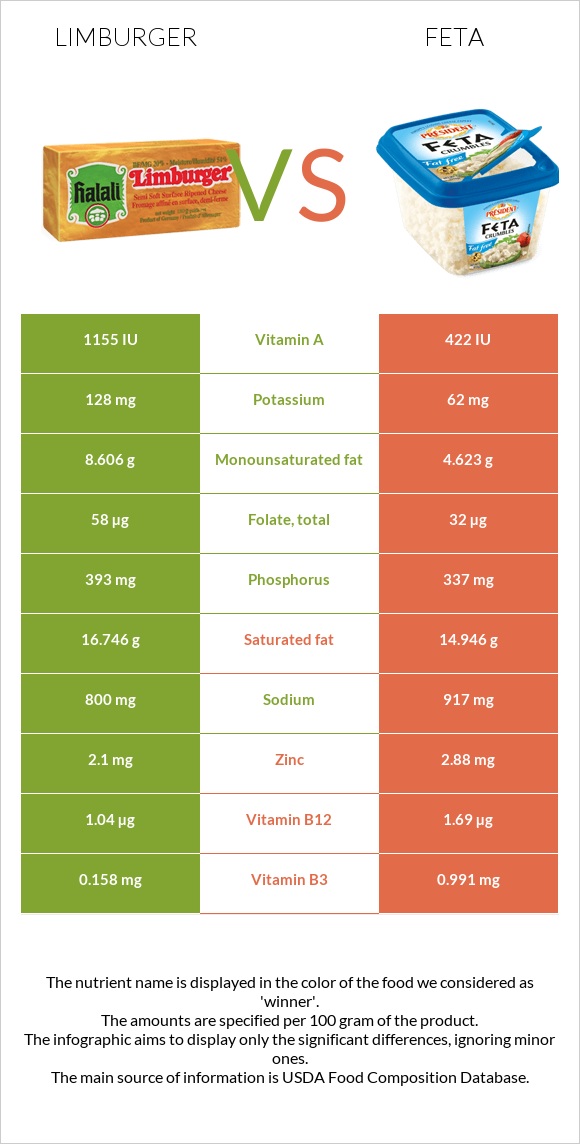
All nutrients comparison - raw data values
Nutrient
DV% diff.
Vitamin B12
1.04µg
1.69µg
27%
Vitamin B2
0.503mg
0.844mg
26%
Vitamin B6
0.086mg
0.424mg
26%
Vitamin A
340µg
125µg
24%
Protein
20.05g
14.21g
12%
Monounsaturated fat
8.606g
4.623g
10%
Fats
27.25g
21.28g
9%
Phosphorus
393mg
337mg
8%
Saturated fat
16.746g
14.946g
8%
Iron
0.13mg
0.65mg
7%
Zinc
2.1mg
2.88mg
7%
Folate
58µg
32µg
7%
Vitamin B1
0.08mg
0.154mg
6%
Sodium
800mg
917mg
5%
Vitamin B3
0.158mg
0.991mg
5%
Vitamin B5
1.177mg
0.967mg
4%
Calories
327kcal
264kcal
3%
Potassium
128mg
62mg
2%
Carbs
0.49g
4.09g
1%
Vitamin D*
20 IU
16 IU
1%
Vitamin D
0.5µg
0.4µg
1%
Copper
0.021mg
0.032mg
1%
Selenium
14.5µg
15µg
1%
Polyunsaturated fat
0.495g
0.591g
1%
Protein per 100 calories
6.1g
5.4g
N/A
Calories per 10 g protein
163kcal
186kcal
N/A
Weight per 100 calories
31g
38g
N/A
Unsaturated / Saturated Fat ratio
0.54
0.35
N/A
Net carbs
0.49g
4.09g
N/A
Cholesterol
90mg
89mg
0%
Magnesium
21mg
19mg
0%
Calcium
497mg
493mg
0%
Sugar
0.49g
4.09g
N/A
Vitamin E
0.23mg
0.18mg
0%
Manganese
0.038mg
0.028mg
0%
Vitamin K
2.3µg
1.8µg
0%
Choline
15.4mg
15.4mg
0%
Tryptophan
0.289mg
0.2mg
0%
Threonine
0.739mg
0.637mg
0%
Isoleucine
1.219mg
0.803mg
0%
Leucine
2.093mg
1.395mg
0%
Lysine
1.675mg
1.219mg
0%
Methionine
0.619mg
0.368mg
0%
Phenylalanine
1.116mg
0.675mg
0%
Valine
1.439mg
1.065mg
0%
Histidine
0.578mg
0.397mg
0%
Macronutrient Comparison
Macronutrient breakdown side-by-side comparison
2
20%
27%
48%
4%
Protein:
20.05 g
Fats:
27.25 g
Carbs:
0.49 g
Water:
48.42 g
Other:
3.79 g
3
14%
21%
4%
55%
5%
Protein:
14.21 g
Fats:
21.28 g
Carbs:
4.09 g
Water:
55.22 g
Other:
5.2 g
Contains
more
Protein Protein
+41.1%
Contains
more
Fats Fats
+28.1%
Contains
more
Carbs Carbs
+734.7%
Contains
more
Water Water
+14%
Contains
more
Other Other
+37.2%
Fat Type Comparison
Fat type breakdown side-by-side comparison
1
65%
33%
2%
Saturated fat:
Sat. Fat
16.746 g
Monounsaturated fat:
Mono. Fat
8.606 g
Polyunsaturated fat:
Poly. Fat
0.495 g
2
74%
23%
3%
Saturated fat:
Sat. Fat
14.946 g
Monounsaturated fat:
Mono. Fat
4.623 g
Polyunsaturated fat:
Poly. Fat
0.591 g
Contains
more
Mono. Fat Monounsaturated fat
+86.2%
Contains
less
Sat. Fat Saturated fat
-10.7%
Contains
more
Poly. Fat Polyunsaturated fat
+19.4%