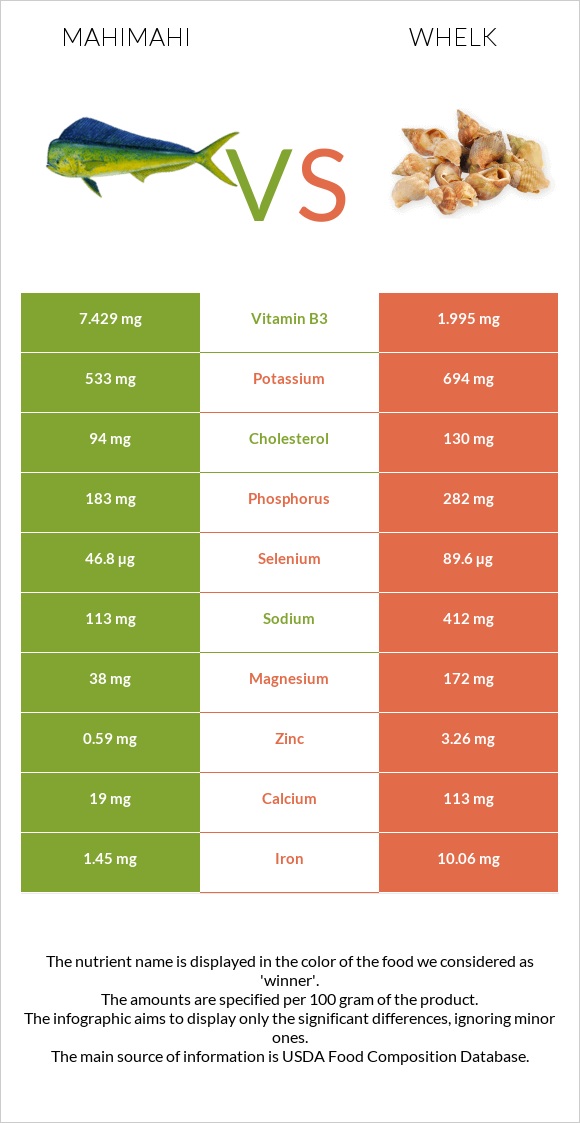
Important differences between mahimahi and whelk Mahimahi has more vitamin B3; however, whelk has more vitamin B12, copper, iron, selenium, manganese, magnesium, zinc, vitamin B6, and phosphorus. Whelk's daily need coverage for vitamin B12 is 727% more. Mahimahi has 4 times more vitamin B3 than whelk. Mahimahi has 7.429mg of vitamin B3, while whelk has 1.995mg. The food varieties used in the comparison are Fish, mahimahi, cooked, dry heat and Mollusks, whelk, unspecified, cooked, moist heat .
Infographic
Mineral Comparison
Mineral comparison score is based on the number of minerals by which one or the other food is richer. The "coverage" charts below show how much of the daily needs can be covered by 300 grams of the food.
1
100 g
300 g
3 oz - 85g 1 fillet - 159g
Magnesium
Magnesium
Calcium
Calcium
Potassium
Potassium
Iron
Iron
Copper
Copper
Zinc
Zinc
Phosphorus
Phosphorus
Sodium
Sodium
Manganese
Manganese
Selenium
Selenium
27%
5.7%
47%
54%
18%
16%
78%
15%
2.5%
255%
9
100 g
300 g
3 oz - 85g
Magnesium
Magnesium
Calcium
Calcium
Potassium
Potassium
Iron
Iron
Copper
Copper
Zinc
Zinc
Phosphorus
Phosphorus
Sodium
Sodium
Manganese
Manganese
Selenium
Selenium
123%
34%
61%
377%
687%
89%
121%
54%
116%
489%
Vitamin Comparison
Vitamin comparison score is based on the number of vitamins by which one or the other food is richer. The "coverage" charts below show how much of the daily needs can be covered by 300 grams of the food.
3
100 g
300 g
3 oz - 85g 1 fillet - 159g
Vitamin C
Vit. C
Vitamin D
Vit. D
Vitamin A
Vit. A
Vitamin E
Vit. E
Vitamin B1
Vit. B1
Vitamin B2
Vit. B2
Vitamin B3
Vit. B3
Vitamin B5
Vit. B5
Vitamin B6
Vit. B6
Vitamin B12
Vit. B12
Vitamin K
Vit. K
Folate
Folate
0%
0%
21%
0%
5.8%
20%
139%
52%
107%
86%
0%
4.5%
6
100 g
300 g
3 oz - 85g
Vitamin C
Vit. C
Vitamin D
Vit. D
Vitamin A
Vit. A
Vitamin E
Vit. E
Vitamin B1
Vit. B1
Vitamin B2
Vit. B2
Vitamin B3
Vit. B3
Vitamin B5
Vit. B5
Vitamin B6
Vit. B6
Vitamin B12
Vit. B12
Vitamin K
Vit. K
Folate
Folate
23%
0%
16%
0%
12%
49%
37%
24%
150%
2268%
0%
8.3%
All nutrients comparison - raw data values
Nutrient
DV% diff.
Vitamin B12
0.69µg
18.14µg
727%
Copper
0.053mg
2.06mg
223%
Iron
1.45mg
10.06mg
108%
Selenium
46.8µg
89.6µg
78%
Protein
23.72g
47.68g
48%
Manganese
0.019mg
0.89mg
38%
Vitamin B3
7.429mg
1.995mg
34%
Magnesium
38mg
172mg
32%
Zinc
0.59mg
3.26mg
24%
Phosphorus
183mg
282mg
14%
Vitamin B6
0.462mg
0.65mg
14%
Sodium
113mg
412mg
13%
Cholesterol
94mg
130mg
12%
Vitamin B2
0.085mg
0.214mg
10%
Calcium
19mg
113mg
9%
Vitamin B5
0.865mg
0.4mg
9%
Calories
109kcal
275kcal
8%
Vitamin C
0mg
6.8mg
8%
Carbs
0g
15.52g
5%
Potassium
533mg
694mg
5%
Vitamin B1
0.023mg
0.049mg
2%
Vitamin A
62µg
49µg
1%
Folate
6µg
11µg
1%
Saturated fat
0.241g
0.062g
1%
Polyunsaturated fat
0.211g
0.046g
1%
Protein per 100 calories
22g
17g
N/A
Calories per 10 g protein
46kcal
58kcal
N/A
Weight per 100 calories
92g
36g
N/A
Fats
0.9g
0.8g
0%
Net carbs
0g
15.52g
N/A
Monounsaturated fat
0.155g
0.056g
0%
Tryptophan
0.266mg
0.618mg
0%
Threonine
1.04mg
2.136mg
0%
Isoleucine
1.093mg
1.655mg
0%
Leucine
1.928mg
3.807mg
0%
Lysine
2.178mg
2.93mg
0%
Methionine
0.702mg
1.205mg
0%
Phenylalanine
0.926mg
1.648mg
0%
Valine
1.222mg
2.075mg
0%
Histidine
0.698mg
0.977mg
0%
Omega-3 - EPA
0.026g
0.008g
N/A
Omega-3 - DHA
0.113g
0.012g
N/A
Omega-3 - DPA
0.012g
N/A
Macronutrient Comparison
Macronutrient breakdown side-by-side comparison
3
24%
71%
4%
Protein:
23.72 g
Fats:
0.9 g
Carbs:
0 g
Water:
71.22 g
Other:
4.16 g
2
48%
16%
32%
4%
Protein:
47.68 g
Fats:
0.8 g
Carbs:
15.52 g
Water:
32 g
Other:
4 g
Contains
more
Fats Fats
+12.5%
Contains
more
Water Water
+122.6%
Contains
more
Protein Protein
+101%
Contains
more
Carbs Carbs
+∞%
Fat Type Comparison
Fat type breakdown side-by-side comparison
2
40%
26%
35%
Saturated fat:
Sat. Fat
0.241 g
Monounsaturated fat:
Mono. Fat
0.155 g
Polyunsaturated fat:
Poly. Fat
0.211 g
1
38%
34%
28%
Saturated fat:
Sat. Fat
0.062 g
Monounsaturated fat:
Mono. Fat
0.056 g
Polyunsaturated fat:
Poly. Fat
0.046 g
Contains
more
Mono. Fat Monounsaturated fat
+176.8%
Contains
more
Poly. Fat Polyunsaturated fat
+358.7%
Contains
less
Sat. Fat Saturated fat
-74.3%