Mars vs. Carob — In-Depth Nutrition Comparison
Compare
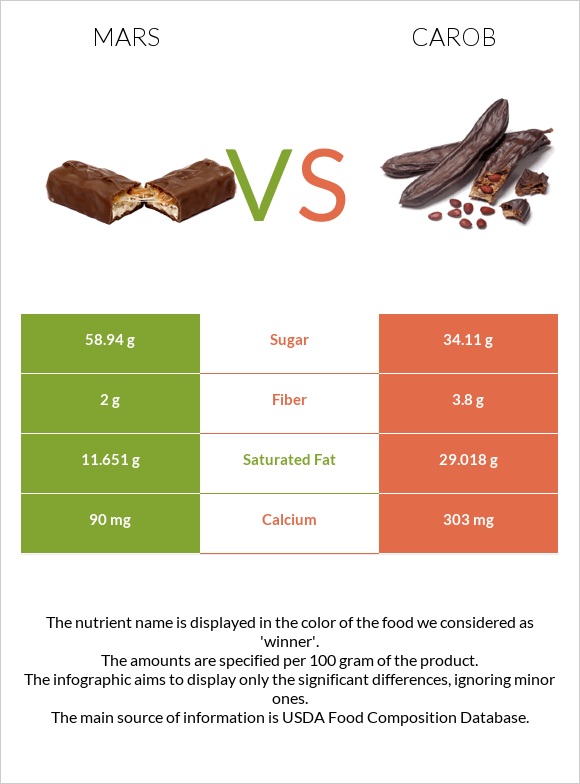
Summary of differences between mars and carob
- The amount of calcium, fiber, and iron in carob is higher than in mars.
- Carob covers your daily need for saturated fat, 87% more than mars.
- Mars contains 2 times more sugar than carob. While mars contains 58.94g of sugar, carob contains only 34.11g.
- Carob has a lower glycemic index. The glycemic index of carob is 39, while the glycemic index of mars is 62.
These are the specific foods used in this comparison Candies, MARS SNACKFOOD US, M&M's Crispy Chocolate Candies and Candies, carob, unsweetened.
Infographic
Infographic link
Mineral Comparison
Mineral comparison score is based on the number of minerals by which one or the other food is richer. The "coverage" charts below show how much of the daily needs can be covered by 300 grams of the food.
| Contains more CalciumCalcium | +236.7% |
| Contains more IronIron | +50% |
| Contains less SodiumSodium | -21.3% |
All nutrients comparison - raw data values
| Nutrient |  |
 |
DV% diff. |
| Saturated fat | 11.651g | 29.018g | 79% |
| Zinc | 3.53mg | 32% | |
| Calcium | 90mg | 303mg | 21% |
| Copper | 0.183mg | 20% | |
| Fats | 19.32g | 31.36g | 19% |
| Potassium | 633mg | 19% | |
| Phosphorus | 126mg | 18% | |
| Vitamin B5 | 0.75mg | 15% | |
| Vitamin B2 | 0.178mg | 14% | |
| Vitamin B12 | 0.28µg | 12% | |
| Vitamin E | 1.57mg | 10% | |
| Vitamin B6 | 0.13mg | 10% | |
| Magnesium | 36mg | 9% | |
| Selenium | 5.2µg | 9% | |
| Protein | 4.28g | 8.15g | 8% |
| Vitamin B1 | 0.1mg | 8% | |
| Fiber | 2g | 3.8g | 7% |
| Vitamin B3 | 1.04mg | 7% | |
| Manganese | 0.14mg | 6% | |
| Vitamin K | 7.7µg | 6% | |
| Carbs | 72.4g | 56.29g | 5% |
| Iron | 0.86mg | 1.29mg | 5% |
| Folate | 21µg | 5% | |
| Cholesterol | 12mg | 1mg | 4% |
| Calories | 475kcal | 540kcal | 3% |
| Choline | 19mg | 3% | |
| Polyunsaturated fat | 0.295g | 2% | |
| Sodium | 136mg | 107mg | 1% |
| Monounsaturated fat | 0.483g | 1% | |
| Protein per 100 calories | 0.9010526315789473g | 1.5092592592592593g | N/A |
| Vitamin C | 0.5mg | 0.5mg | 0% |
| Net carbs | 70.4g | 52.49g | N/A |
| Sugar | 58.94g | 34.11g | N/A |
| Vitamin A | 1µg | 0% | |
| Trans fat | 0.131g | 0g | N/A |
Macronutrient Comparison
Macronutrient breakdown side-by-side comparison
| Contains more CarbsCarbs | +28.6% |
| Contains more ProteinProtein | +90.4% |
| Contains more FatsFats | +62.3% |
| Contains more OtherOther | +15.7% |
~equal in
Water
~1.54g
Fat Type Comparison
Fat type breakdown side-by-side comparison
| Contains less Sat. FatSaturated fat | -59.8% |


