McDonald's cheeseburger vs. McDonald's Quarter Pounder — In-Depth Nutrition Comparison
Compare
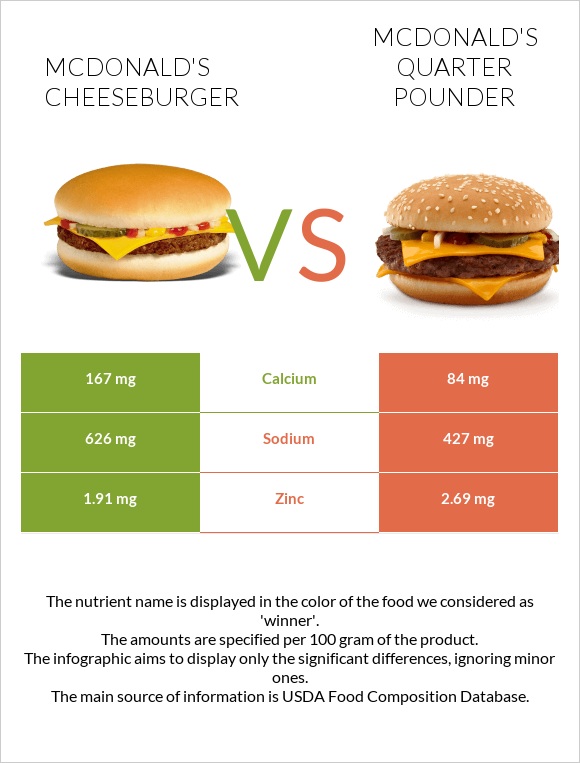
What are the differences between mcDonald's cheeseburgers and McDonald's Quarter Pounder?
- McDonald's cheeseburgers are higher in calcium, yet McDonald's Quarter Pounder is higher in vitamin B12, zinc, and vitamin B2.
- McDonald's Quarter Pounder's daily need coverage for vitamin B12 is 18% more.
- McDonald's cheeseburgers have 2 times more calcium than McDonald's Quarter Pounder. While mcDonald's cheeseburgers have 167mg of calcium, McDonald's Quarter Pounder has only 84mg.
- The amount of sodium in McDonald's Quarter Pounder is lower.
We used McDONALD'S, Cheeseburger and McDONALD'S, QUARTER POUNDER types in this article.
Infographic
Infographic link
Mineral Comparison
Mineral comparison score is based on the number of minerals by which one or the other food is richer. The "coverage" charts below show how much of the daily needs can be covered by 300 grams of the food.
| Contains more CalciumCalcium | +98.8% |
| Contains more PhosphorusPhosphorus | +12.9% |
| Contains more ManganeseManganese | +15.6% |
| Contains more PotassiumPotassium | +13.5% |
| Contains more CopperCopper | +10.3% |
| Contains more ZincZinc | +40.8% |
| Contains less SodiumSodium | -31.8% |
Vitamin Comparison
Vitamin comparison score is based on the number of vitamins by which one or the other food is richer. The "coverage" charts below show how much of the daily needs can be covered by 300 grams of the food.
| Contains more Vitamin B1Vitamin B1 | +21.9% |
| Contains more Vitamin CVitamin C | +50% |
| Contains more Vitamin B2Vitamin B2 | +32.3% |
| Contains more Vitamin B3Vitamin B3 | +10.6% |
| Contains more Vitamin B12Vitamin B12 | +48.8% |
All nutrients comparison - raw data values
| Nutrient |  |
 |
DV% diff. |
| Vitamin B12 | 0.86µg | 1.28µg | 18% |
| Sodium | 626mg | 427mg | 9% |
| Calcium | 167mg | 84mg | 8% |
| Zinc | 1.91mg | 2.69mg | 7% |
| Vitamin B2 | 0.26mg | 0.344mg | 6% |
| Vitamin B1 | 0.223mg | 0.183mg | 3% |
| Vitamin B3 | 4.026mg | 4.452mg | 3% |
| Protein | 12.97g | 14.1g | 2% |
| Carbs | 27.81g | 22.17g | 2% |
| Fiber | 1.1g | 1.6g | 2% |
| Phosphorus | 140mg | 124mg | 2% |
| Saturated fat | 4.435g | 4.008g | 2% |
| Calories | 263kcal | 244kcal | 1% |
| Cholesterol | 35mg | 39mg | 1% |
| Potassium | 200mg | 227mg | 1% |
| Iron | 2.35mg | 2.41mg | 1% |
| Copper | 0.097mg | 0.107mg | 1% |
| Manganese | 0.23mg | 0.199mg | 1% |
| Folate | 59µg | 56µg | 1% |
| Monounsaturated fat | 3.631g | 4.202g | 1% |
| Protein per 100 calories | 4.9g | 5.8g | N/A |
| Calories per 10 g protein | 203kcal | 173kcal | N/A |
| Weight per 100 calories | 38g | 41g | N/A |
| Fats | 11.79g | 11.55g | 0% |
| Unsaturated / Saturated Fat ratio | 0.9 | 1.1 | N/A |
| Vitamin C | 0.6mg | 0.9mg | 0% |
| Net carbs | 26.71g | 20.57g | N/A |
| Magnesium | 20mg | 22mg | 0% |
| Sugar | 6.22g | 5.13g | N/A |
| Trans fat | 0.647g | 0.724g | N/A |
| Polyunsaturated fat | 0.355g | 0.283g | 0% |
| Fructose | 2.59g | 2.2g | 0% |
Macronutrient Comparison
Macronutrient breakdown side-by-side comparison
Protein:
12.97 g
Fats:
11.79 g
Carbs:
27.81 g
Water:
45 g
Other:
2.43 g
Protein:
14.1 g
Fats:
11.55 g
Carbs:
22.17 g
Water:
50.37 g
Other:
1.81 g
| Contains more CarbsCarbs | +25.4% |
| Contains more OtherOther | +34.3% |
| Contains more WaterWater | +11.9% |
~equal in
Protein
~14.1g
~equal in
Fats
~11.55g
Fat Type Comparison
Fat type breakdown side-by-side comparison
Saturated fat:
Sat. Fat
4.435 g
Monounsaturated fat:
Mono. Fat
3.631 g
Polyunsaturated fat:
Poly. Fat
0.355 g
Saturated fat:
Sat. Fat
4.008 g
Monounsaturated fat:
Mono. Fat
4.202 g
Polyunsaturated fat:
Poly. Fat
0.283 g
| Contains more Poly. FatPolyunsaturated fat | +25.4% |
| Contains more Mono. FatMonounsaturated fat | +15.7% |
~equal in
Saturated fat
~4.008g
Carbohydrate type comparison
Carbohydrate type breakdown side-by-side comparison
Starch:
0 g
Sucrose:
0.24 g
Glucose:
2.01 g
Fructose:
2.59 g
Lactose:
0.54 g
Maltose:
0.84 g
Galactose:
0 g
Starch:
0 g
Sucrose:
0.22 g
Glucose:
1.91 g
Fructose:
2.2 g
Lactose:
0.07 g
Maltose:
0.73 g
Galactose:
0 g
| Contains more FructoseFructose | +17.7% |
| Contains more LactoseLactose | +671.4% |
| Contains more MaltoseMaltose | +15.1% |
~equal in
Starch
~0g
~equal in
Sucrose
~0.22g
~equal in
Glucose
~1.91g
~equal in
Galactose
~0g


