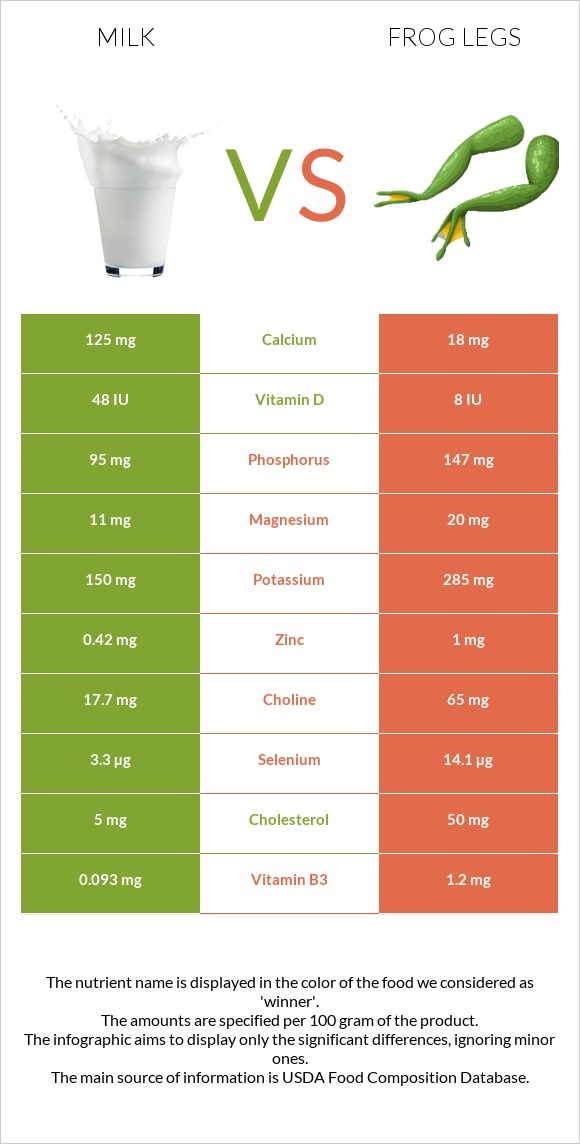
Important differences between milk and frog legs Milk has more calcium; however, frog legs are richer in copper, selenium, iron, vitamin B1, choline, phosphorus, vitamin B3, and vitamin E. Frog legs' daily need coverage for copper is 27% more. Milk contains 7 times more calcium than frog legs. Milk contains 125mg of calcium, while frog legs contain 18mg. Milk contains less cholesterol. Milk has a higher glycemic index. The glycemic index of milk is 31, while the glycemic index of frog legs is 0. The food varieties used in the comparison are Milk, lowfat, fluid, 1% milkfat, with added vitamin A and vitamin D and Frog legs, raw .
Infographic
Mineral Comparison
Mineral comparison score is based on the number of minerals by which one or the other food is richer. The "coverage" charts below show how much of the daily needs can be covered by 300 grams of the food.
3
100 g
300 g
1 fl oz - 30.5g 1 cup - 244g 1 quart - 976g
Magnesium
Magnesium
Calcium
Calcium
Potassium
Potassium
Iron
Iron
Copper
Copper
Zinc
Zinc
Phosphorus
Phosphorus
Sodium
Sodium
Manganese
Manganese
Selenium
Selenium
7.9%
38%
13%
1.1%
3.3%
11%
41%
5.7%
0.39%
18%
7
100 g
300 g
1 leg - 45g
Magnesium
Magnesium
Calcium
Calcium
Potassium
Potassium
Iron
Iron
Copper
Copper
Zinc
Zinc
Phosphorus
Phosphorus
Sodium
Sodium
Manganese
Manganese
Selenium
Selenium
14%
5.4%
25%
56%
83%
27%
63%
7.6%
0%
77%
Vitamin Comparison
Vitamin comparison score is based on the number of vitamins by which one or the other food is richer. The "coverage" charts below show how much of the daily needs can be covered by 300 grams of the food.
4
100 g
300 g
1 fl oz - 30.5g 1 cup - 244g 1 quart - 976g
Vitamin C
Vit. C
Vitamin D
Vit. D
Vitamin A
Vit. A
Vitamin E
Vit. E
Vitamin B1
Vit. B1
Vitamin B2
Vit. B2
Vitamin B3
Vit. B3
Vitamin B5
Vit. B5
Vitamin B6
Vit. B6
Vitamin B12
Vit. B12
Vitamin K
Vit. K
Folate
Folate
0%
18%
19%
0.2%
5%
43%
1.7%
22%
8.5%
59%
0.25%
3.8%
6
100 g
300 g
1 leg - 45g
Vitamin C
Vit. C
Vitamin D
Vit. D
Vitamin A
Vit. A
Vitamin E
Vit. E
Vitamin B1
Vit. B1
Vitamin B2
Vit. B2
Vitamin B3
Vit. B3
Vitamin B5
Vit. B5
Vitamin B6
Vit. B6
Vitamin B12
Vit. B12
Vitamin K
Vit. K
Folate
Folate
0%
3%
5%
20%
35%
58%
23%
0%
28%
50%
0.25%
11%
All nutrients comparison - raw data values
Nutrient
DV% diff.
Copper
0.01mg
0.25mg
27%
Protein
3.37g
16.4g
26%
Selenium
3.3µg
14.1µg
20%
Iron
0.03mg
1.5mg
18%
Cholesterol
5mg
50mg
15%
Calcium
125mg
18mg
11%
Vitamin B1
0.02mg
0.14mg
10%
Choline
17.7mg
65mg
9%
Phosphorus
95mg
147mg
7%
Vitamin E
0.01mg
1mg
7%
Vitamin B3
0.093mg
1.2mg
7%
Vitamin B5
0.361mg
7%
Vitamin B6
0.037mg
0.12mg
6%
Vitamin D*
48 IU
8 IU
5%
Vitamin D
1.2µg
0.2µg
5%
Zinc
0.42mg
1mg
5%
Vitamin A
58µg
15µg
5%
Vitamin B2
0.185mg
0.25mg
5%
Potassium
150mg
285mg
4%
Vitamin B12
0.47µg
0.4µg
3%
Folate
5µg
15µg
3%
Saturated fat
0.633g
0.076g
3%
Calories
42kcal
73kcal
2%
Carbs
4.99g
0g
2%
Magnesium
11mg
20mg
2%
Fats
0.97g
0.3g
1%
Sodium
44mg
58mg
1%
Monounsaturated fat
0.277g
0.053g
1%
Protein per 100 calories
8g
22g
N/A
Calories per 10 g protein
125kcal
45kcal
N/A
Weight per 100 calories
238g
137g
N/A
Net carbs
4.99g
0g
N/A
Sugar
5.2g
0g
N/A
Manganese
0.003mg
0%
Vitamin K
0.1µg
0.1µg
0%
Polyunsaturated fat
0.035g
0.102g
0%
Tryptophan
0.043mg
0%
Threonine
0.143mg
0%
Isoleucine
0.174mg
0%
Leucine
0.319mg
0%
Lysine
0.282mg
0%
Methionine
0.088mg
0%
Phenylalanine
0.174mg
0%
Valine
0.22mg
0%
Histidine
0.101mg
0%
Omega-3 - EPA
0g
0.014g
N/A
Omega-3 - DHA
0g
0.02g
N/A
Omega-3 - ALA
0.004g
N/A
Omega-3 - DPA
0g
0.007g
N/A
Omega-6 - Linoleic acid
0.027g
N/A
Macronutrient Comparison
Macronutrient breakdown side-by-side comparison
3
3%
5%
90%
Protein:
3.37 g
Fats:
0.97 g
Carbs:
4.99 g
Water:
89.92 g
Other:
0.75 g
2
16%
82%
Protein:
16.4 g
Fats:
0.3 g
Carbs:
0 g
Water:
81.9 g
Other:
1.4 g
Contains
more
Fats Fats
+223.3%
Contains
more
Carbs Carbs
+∞%
Contains
more
Protein Protein
+386.6%
Contains
more
Other Other
+86.7%
Fat Type Comparison
Fat type breakdown side-by-side comparison
1
67%
29%
4%
Saturated fat:
Sat. Fat
0.633 g
Monounsaturated fat:
Mono. Fat
0.277 g
Polyunsaturated fat:
Poly. Fat
0.035 g
2
33%
23%
44%
Saturated fat:
Sat. Fat
0.076 g
Monounsaturated fat:
Mono. Fat
0.053 g
Polyunsaturated fat:
Poly. Fat
0.102 g
Contains
more
Mono. Fat Monounsaturated fat
+422.6%
Contains
less
Sat. Fat Saturated fat
-88%
Contains
more
Poly. Fat Polyunsaturated fat
+191.4%