Milkshake vs. Malt — Health Impact and Nutrition Comparison


Summary
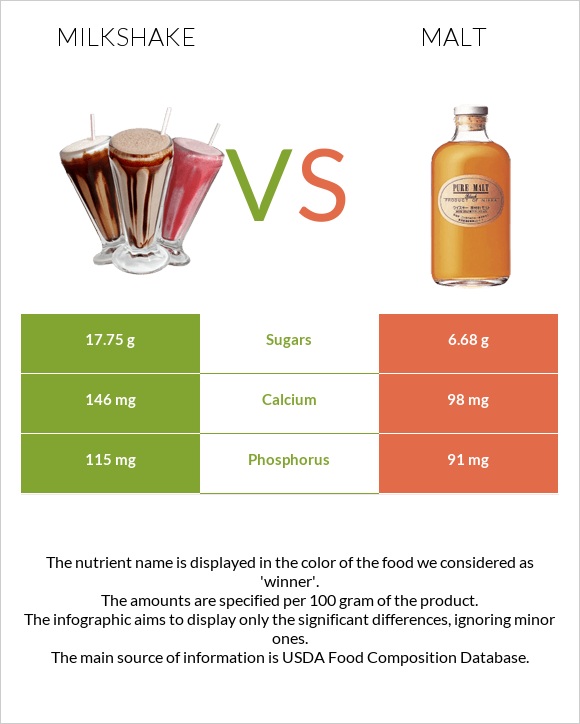
Malt generally contains more selenium compared to milkshakes. However, the milkshake contains substantially more sugar, with 17.75g compared to malt's 6.68g. Additionally, milkshakes have higher phosphorus, potassium, and sodium levels than malt. On the other hand, malt is richer in iron, magnesium, zinc, copper, and manganese. Milkshakes contain vitamin D, which is absent in malt. However, malt generally contains higher levels of various B vitamins than milkshakes. Additionally, malt provides more vitamin A.
What’s The Difference?
A malt, or malted milkshake, is similar to a milkshake but contains malted milk powder. As a bonus, they were also alcohol-free, which was popular with the temperance movement at the time.
Originally, milkshakes were eggnog-like drinks made with eggs and whiskey and served as a tonic or treat. As the 1900s progressed, milkshakes underwent a complete makeover, and the ingredients changed drastically. Instead of eggs, ice cream was added, and whiskey was substituted with chocolate, vanilla, and strawberry syrups.
Nutrition
The infographics below present the nutritional numbers for 100g serving sizes of milkshakes and malt. The serving sizes for a milkshake and a malt differ, with the milkshake typically measured at one container (11 oz) or 313 grams, while the malt is portioned as 1 cup (8 fl oz) or 265 grams.
Macronutrients and Calories
Milkshake is somewhat denser in nutrients, containing 18% carbohydrates, 74% water, 4% protein, 3% fat, and other nutrients. Conversely, malt comprises 11% carbohydrates, 81% water, 3% fats, 3% proteins, and other nutrients.
Macronutrient Comparison
Contains
more
ProteinProtein
+14.5%
Contains
more
CarbsCarbs
+58.5%
Contains
more
OtherOther
+13.8%
Calories
Both milkshakes and malt are high-calorie foods. In each 100g serving, a milkshake provides 112 calories, while malt has 85 calories.
Protein
The protein amounts are relatively close. A milkshake contains approximately 3.86g of protein, while a malt contains around 3.37g.
Fats
In terms of fat content, a malt contains approximately 3.29g, while a milkshake has around 3.03g.
Fat Type Comparison
Contains
more
Poly. FatPolyunsaturated fat
+84.1%
Cholesterol
When comparing the cholesterol content between milkshakes and malt, milkshakes generally contain slightly higher levels. For example, a milkshake serving may contain around 12mg of cholesterol, while a malt serving typically contains about 10mg.
Carbohydrates
Milkshakes are higher in carbohydrates compared to malt. A 100g milkshake serving provides 17.75 grams of carbs, whereas malt contains 11.2 grams.
All 100% of carbohydrates in milkshakes comprise net carbs, and malt comprises net carbs, sugar, and 0.5g of fiber.
Vitamins
Malt contains slightly higher amounts of vitamin A (91 IU compared to 95 IU), vitamin C (0.1 mg), vitamin B3 (0.259 mg), and vitamin B1 (0.054 mg). Both contain almost the exact content of vitamin E (0.05–0.06 mg), vitamin K (0.2–0.3 mg), vitamin B6 (0.042–0.046 mg), vitamin B2 (0.195-0.184 mg), and vitamin B5 (0.368–0.354 mg) than the milkshake. On the other hand, the milkshake has higher levels of vitamin D (48 IU) and a slightly higher vitamin B12 compared to malt, which lacks vitamin D.
Vitamin Comparison
Contains
more
Vitamin DVitamin D
+∞%
Contains
more
Vitamin B12Vitamin B12
+23.8%
Contains
more
Vitamin CVitamin C
+∞%
Contains
more
Vitamin EVitamin E
+20%
Contains
more
Vitamin B1Vitamin B1
+80%
Contains
more
Vitamin B3Vitamin B3
+77.4%
Contains
more
Vitamin KVitamin K
+50%
Contains
more
FolateFolate
+28.6%
Minerals
Milkshake has more calcium content at 146mg, and malt follows closely at 98mg. Malt is slightly higher in iron (0.21 mg), magnesium (15mg), selenium (5.4mg), and manganese (0.08mg). Milkshake has more phosphorus content at 115mg and potassium at 183mg, whereas malt follows closely with 172mg. In sodium content, malt contains 60mg, while milkshake has a slightly higher level at 95mg.
Zinc content is comparable, with malt at 0.41mg and milkshake at 0.39mg. Milkshake has a slightly higher copper content (0.051mg) than malt (0.037mg).
Mineral Comparison
Contains
more
CalciumCalcium
+49%
Contains
more
CopperCopper
+37.8%
Contains
more
PhosphorusPhosphorus
+26.4%
Contains
more
MagnesiumMagnesium
+25%
Contains
more
IronIron
+110%
Contains
less
SodiumSodium
-36.8%
Contains
more
ManganeseManganese
+471.4%
Contains
more
SeleniumSelenium
+134.8%
Glycemic Index
Malt has a glycemic index of 59, which categorizes it as a medium-glycemic food. In contrast, milkshake has a glycemic index of 27, placing it in the low-glycemic category.
Glycemic Load
Both milkshake and malt have medium glycemic loads, with malt slightly higher at 17 compared to milkshake's 15.
Acidity
Milkshake is slightly acidic, with an acidity score of 0.1 based on PRAL, indicating a neutral effect on the body's acid-base balance. In contrast, malt has a score of -0.3, indicating an alkaline effect.
Health Impact
Milkshakes and malts can be a source of pleasure and satisfaction, especially when consumed in moderation as part of a balanced diet, but they are not considered healthy foods.
Cardiovascular Health
Both milkshakes and malts typically contain ingredients like ice cream, milk, and flavorings such as syrups or malted milk powder. These ingredients are high in sugar, calories, and saturated fat. Due to their high calorie, sugar, and saturated fat content, milkshakes and malts can negatively affect cardiovascular health. Drinking these drinks in excess can lead to weight gain, obesity, and high triglyceride and cholesterol levels—all of which increase the risk of heart disease and stroke (1, 2).
Diabetes
Milkshakes and malts' high sugar content can also affect blood sugar levels, raising the risk of type 2 diabetes or exacerbating symptoms in those who already have the disease. Frequent intake of these high-sugar beverages might increase the risk of problems connected to diabetes by causing insulin resistance and metabolic dysfunction (3,4).
Digestive Health
Regarding digestive health, excessive sugar and saturated fat intake from milkshakes and malts can disrupt gut microbiota balance and contribute to gastrointestinal issues such as bloating, gas, and constipation (5, 6). Additionally, the additives and preservatives found in malted milk powder may irritate the digestive system in some individuals, leading to discomfort or digestive disturbances (7).
Lactose Intolerance
Milkshakes and malts typically contain lactose because they are made with dairy ingredients such as milk and ice cream. Milk and dairy products naturally contain lactose, a type of sugar.
Therefore, lactose-intolerant individuals may experience discomfort or digestive issues after consuming milkshakes or malts(8). However, lactose-free alternatives such as lactose-free milk or non-dairy ice cream can make lactose-free versions of these beverages.
Cancer
While there is limited direct evidence linking milkshakes and malts to cancer, their high calorie and sugar content can indirectly impact cancer risk by promoting obesity and inflammation, both of which are associated with a high likelihood of developing certain types of cancer (9).
Production
While the components and methods of preparation are similar, there are also unique qualities that distinguish each. Both milkshakes and malts can be prepared using a blender or machine, ensuring that the ingredients are thoroughly mixed and blended.
Milkshakes and malts start with a base of ice cream and milk, but adding malted milk powder gives malts a more prosperous, sweeter, and toasty flavor than traditional milkshakes. Malted milk powder is made from malted wheat flour, barley, and evaporated whole milk, which adds a distinct flavor profile to malts. This ingredient also contributes to a thicker consistency in malts compared to shakes. The ice cream and milk are blended for a milkshake until they reach a smooth and creamy consistency. Combine all the ingredients in a blender and process until the desired consistency is achieved. Flavorings, such as syrups or fruits, can be added during this blending process to enhance the taste. A tall milkshake glass is served with whipped cream, syrup, or other toppings of your choice once the milkshake reaches the right consistency. Soon, chocolate syrup, milk, and malted milk powder-based sweet drinks became a soda fountain staple.
Taste and Use
Indulgent and refreshing, milkshakes and malts satisfy sweet cravings and evoke nostalgic memories of retro diners and soda fountains. These delicious candies are available in various flavors, from traditional choices such as chocolate and vanilla to unique ones like strawberry, banana, peanut butter, and cookies.
One distinguishing element of malts is the incorporation of malted milk powder, adding a distinctive flavor that sets them apart from traditional milkshakes. Complementing the base flavors, additional enhancements like chocolate syrup, fruit syrups, or crushed cookies can be mixed in to elevate the taste profile, making each sip a delightful experience.
To truly elevate these delectable concoctions, toppings play a crucial role. Whipped cream, chocolate shavings, cherries, and other adornments add layers of flavor and enhance the visual appeal, turning a simple beverage into a decadent indulgence.
While milkshakes are commonly enjoyed in fast-food restaurants and modern eateries as a refreshing beverage or dessert paired with classic favorites like burgers and fries, malted shakes evoke nostalgia. They harken back to the charm of old-school soda shops and diners that have cherished them since the early 20th century.
Sources
- https://www.sciencedirect.com/science/article/abs/pii/S0140673600040411
- https://pubmed.ncbi.nlm.nih.gov/24493081/
- https://pubmed.ncbi.nlm.nih.gov/15328324/
- https://www.ncbi.nlm.nih.gov/pmc/articles/PMC8472506/
- https://pubmed.ncbi.nlm.nih.gov/32397233/
- https://pubmed.ncbi.nlm.nih.gov/37562163/
- https://pubmed.ncbi.nlm.nih.gov/36677689/
- https://pubmed.ncbi.nlm.nih.gov/30783042/
- https://pubmed.ncbi.nlm.nih.gov/36551528/

Infographic
All nutrients comparison - raw data values
| Nutrient | |
|
DV% diff. |
| Vitamin D* | 48 IU | 6% | |
| Vitamin D | 1.2µg | 6% | |
| Selenium | 2.3µg | 5.4µg | 6% |
| Calcium | 146mg | 98mg | 5% |
| Vitamin B12 | 0.52µg | 0.42µg | 4% |
| Phosphorus | 115mg | 91mg | 3% |
| Manganese | 0.014mg | 0.08mg | 3% |
| Choline | 14.3mg | 3% | |
| Carbs | 17.75g | 11.2g | 2% |
| Fiber | 0g | 0.5g | 2% |
| Copper | 0.051mg | 0.037mg | 2% |
| Sodium | 95mg | 60mg | 2% |
| Vitamin B1 | 0.03mg | 0.054mg | 2% |
| Calories | 112kcal | 85kcal | 1% |
| Protein | 3.86g | 3.37g | 1% |
| Cholesterol | 12mg | 10mg | 1% |
| Magnesium | 12mg | 15mg | 1% |
| Iron | 0.1mg | 0.21mg | 1% |
| Vitamin B2 | 0.195mg | 0.184mg | 1% |
| Vitamin B3 | 0.146mg | 0.259mg | 1% |
| Folate | 7µg | 9µg | 1% |
| Polyunsaturated fat | 0.113g | 0.208g | 1% |
| Caffeine | 0mg | 3mg | 1% |
| Protein per 100 calories | 3.4g | 4g | N/A |
| Calories per 10 g protein | 290kcal | 252kcal | N/A |
| Weight per 100 calories | 89g | 118g | N/A |
| Fats | 3.03g | 3.29g | 0% |
| Unsaturated / Saturated Fat ratio | 0.52 | 0.55 | N/A |
| Vitamin C | 0mg | 0.1mg | 0% |
| Net carbs | 17.75g | 10.7g | N/A |
| Potassium | 183mg | 172mg | 0% |
| Sugar | 17.75g | 6.68g | N/A |
| Zinc | 0.39mg | 0.41mg | 0% |
| Vitamin A | 25µg | 26µg | 0% |
| Vitamin E | 0.05mg | 0.06mg | 0% |
| Vitamin B5 | 0.368mg | 0.354mg | 0% |
| Vitamin B6 | 0.042mg | 0.046mg | 0% |
| Vitamin K | 0.2µg | 0.3µg | 0% |
| Saturated fat | 1.886g | 1.883g | 0% |
| Monounsaturated fat | 0.875g | 0.827g | 0% |
| Tryptophan | 0.054mg | 0.074mg | 0% |
| Threonine | 0.174mg | 0.143mg | 0% |
| Isoleucine | 0.234mg | 0.165mg | 0% |
| Leucine | 0.378mg | 0.268mg | 0% |
| Lysine | 0.306mg | 0.142mg | 0% |
| Methionine | 0.097mg | 0.074mg | 0% |
| Phenylalanine | 0.186mg | 0.15mg | 0% |
| Valine | 0.258mg | 0.193mg | 0% |
| Histidine | 0.105mg | 0.077mg | 0% |
People also compare


References
All the values for which the sources are not specified explicitly are taken from FDA’s Food Central. The exact link to the food presented on this page can be found below.
- Milkshake - https://fdc.nal.usda.gov/fdc-app.html#/food-details/170884/nutrients
- Malt - https://fdc.nal.usda.gov/fdc-app.html#/food-details/174867/nutrients
All the Daily Values are presented for males aged 31-50, for 2000-calorie diets.