Infographic
Mineral Comparison
Mineral comparison score is based on the number of minerals by which one or the other food is richer. The "coverage" charts below show how much of the daily needs can be covered by 300 grams of the food.
6
100 g
300 g
1 fl oz - 28.4g 1 container (11 oz) - 313g
Magnesium
Magnesium
Calcium
Calcium
Potassium
Potassium
Iron
Iron
Copper
Copper
Zinc
Zinc
Phosphorus
Phosphorus
Sodium
Sodium
Manganese
Manganese
Selenium
Selenium
8.6%
44%
16%
3.8%
17%
11%
49%
12%
1.8%
13%
2
100 g
300 g
1 fl oz - 30.5g 1 cup - 244g 1 quart - 976g
Magnesium
Magnesium
Calcium
Calcium
Potassium
Potassium
Iron
Iron
Copper
Copper
Zinc
Zinc
Phosphorus
Phosphorus
Sodium
Sodium
Manganese
Manganese
Selenium
Selenium
7.9%
38%
13%
1.1%
3.3%
11%
41%
5.7%
0.39%
18%
Vitamin Comparison
Vitamin comparison score is based on the number of vitamins by which one or the other food is richer. The "coverage" charts below show how much of the daily needs can be covered by 300 grams of the food.
6
100 g
300 g
1 fl oz - 28.4g 1 container (11 oz) - 313g
Vitamin C
Vit. C
Vitamin D
Vit. D
Vitamin A
Vit. A
Vitamin E
Vit. E
Vitamin B1
Vit. B1
Vitamin B2
Vit. B2
Vitamin B3
Vit. B3
Vitamin B5
Vit. B5
Vitamin B6
Vit. B6
Vitamin B12
Vit. B12
Vitamin K
Vit. K
Folate
Folate
0%
18%
8.3%
1%
7.5%
45%
2.7%
22%
9.7%
65%
0.5%
5.3%
1
100 g
300 g
1 fl oz - 30.5g 1 cup - 244g 1 quart - 976g
Vitamin C
Vit. C
Vitamin D
Vit. D
Vitamin A
Vit. A
Vitamin E
Vit. E
Vitamin B1
Vit. B1
Vitamin B2
Vit. B2
Vitamin B3
Vit. B3
Vitamin B5
Vit. B5
Vitamin B6
Vit. B6
Vitamin B12
Vit. B12
Vitamin K
Vit. K
Folate
Folate
0%
18%
19%
0.2%
5%
43%
1.7%
22%
8.5%
59%
0.25%
3.8%
All nutrients comparison - raw data values
Nutrient
DV% diff.
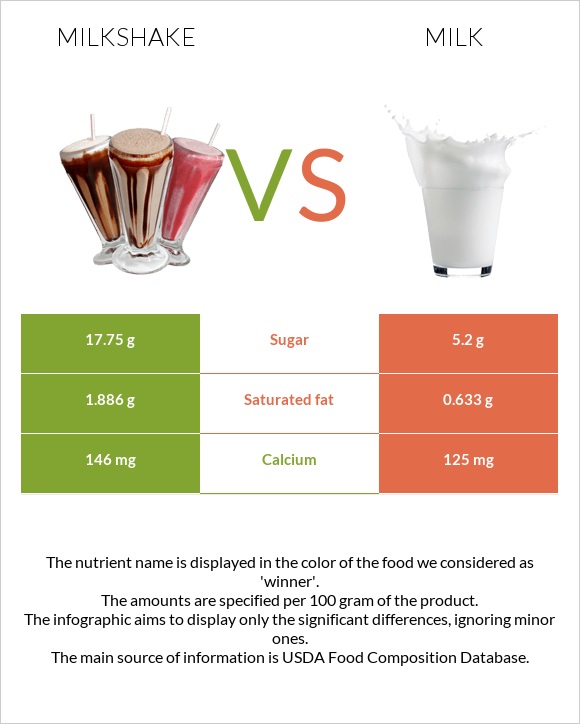
Saturated fat
1.886g
0.633g
6%
Copper
0.051mg
0.01mg
5%
Calories
112kcal
42kcal
4%
Carbs
17.75g
4.99g
4%
Vitamin A
25µg
58µg
4%
Fats
3.03g
0.97g
3%
Phosphorus
115mg
95mg
3%
Cholesterol
12mg
5mg
2%
Calcium
146mg
125mg
2%
Sodium
95mg
44mg
2%
Selenium
2.3µg
3.3µg
2%
Vitamin B12
0.52µg
0.47µg
2%
Protein
3.86g
3.37g
1%
Potassium
183mg
150mg
1%
Iron
0.1mg
0.03mg
1%
Vitamin B1
0.03mg
0.02mg
1%
Vitamin B2
0.195mg
0.185mg
1%
Folate
7µg
5µg
1%
Choline
14.3mg
17.7mg
1%
Monounsaturated fat
0.875g
0.277g
1%
Polyunsaturated fat
0.113g
0.035g
1%
Protein per 100 calories
3.4g
8g
N/A
Calories per 10 g protein
290kcal
125kcal
N/A
Weight per 100 calories
89g
238g
N/A
Unsaturated / Saturated Fat ratio
0.52
0.49
N/A
Net carbs
17.75g
4.99g
N/A
Vitamin D*
48 IU
48 IU
0%
Vitamin D
1.2µg
1.2µg
0%
Magnesium
12mg
11mg
0%
Sugar
17.75g
5.2g
N/A
Zinc
0.39mg
0.42mg
0%
Vitamin E
0.05mg
0.01mg
0%
Manganese
0.014mg
0.003mg
0%
Vitamin B3
0.146mg
0.093mg
0%
Vitamin B5
0.368mg
0.361mg
0%
Vitamin B6
0.042mg
0.037mg
0%
Vitamin K
0.2µg
0.1µg
0%
Tryptophan
0.054mg
0.043mg
0%
Threonine
0.174mg
0.143mg
0%
Isoleucine
0.234mg
0.174mg
0%
Leucine
0.378mg
0.319mg
0%
Lysine
0.306mg
0.282mg
0%
Methionine
0.097mg
0.088mg
0%
Phenylalanine
0.186mg
0.174mg
0%
Valine
0.258mg
0.22mg
0%
Histidine
0.105mg
0.101mg
0%
Omega-3 - ALA
0.004g
N/A
Omega-6 - Linoleic acid
0.027g
N/A
Macronutrient Comparison
Macronutrient breakdown side-by-side comparison
4
4%
3%
18%
74%
Protein:
3.86 g
Fats:
3.03 g
Carbs:
17.75 g
Water:
74.45 g
Other:
0.91 g
1
3%
5%
90%
Protein:
3.37 g
Fats:
0.97 g
Carbs:
4.99 g
Water:
89.92 g
Other:
0.75 g
Contains
more
Protein Protein
+14.5%
Contains
more
Fats Fats
+212.4%
Contains
more
Carbs Carbs
+255.7%
Contains
more
Other Other
+21.3%
Contains
more
Water Water
+20.8%
Fat Type Comparison
Fat type breakdown side-by-side comparison
2
66%
30%
4%
Saturated fat:
Sat. Fat
1.886 g
Monounsaturated fat:
Mono. Fat
0.875 g
Polyunsaturated fat:
Poly. Fat
0.113 g
1
67%
29%
4%
Saturated fat:
Sat. Fat
0.633 g
Monounsaturated fat:
Mono. Fat
0.277 g
Polyunsaturated fat:
Poly. Fat
0.035 g
Contains
more
Mono. Fat Monounsaturated fat
+215.9%
Contains
more
Poly. Fat Polyunsaturated fat
+222.9%
Contains
less
Sat. Fat Saturated fat
-66.4%