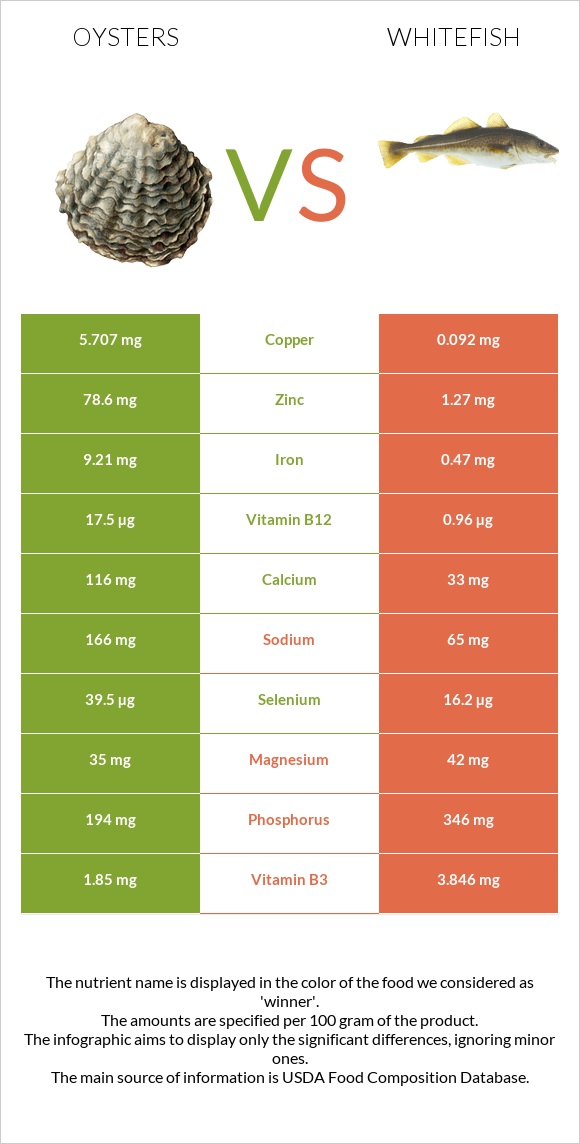
Important differences between oysters and whitefish Oysters has more zinc, vitamin B12, copper, iron, selenium, and manganese; however, whitefish has more vitamin B6, phosphorus, vitamin B3, and vitamin B1. Oysters's daily need coverage for zinc is 703% more. Oysters has 62 times more copper than whitefish. Oysters has 5.707mg of copper, while whitefish has 0.092mg. The food varieties used in the comparison are Mollusks, oyster, eastern, wild, cooked, moist heat and Fish, whitefish, mixed species, cooked, dry heat .
Infographic
Mineral Comparison
Mineral comparison score is based on the number of minerals by which one or the other food is richer. The "coverage" charts below show how much of the daily needs can be covered by 300 grams of the food.
6
100 g
300 g
6 medium - 42g 3 oz - 85g
Magnesium
Magnesium
Calcium
Calcium
Potassium
Potassium
Iron
Iron
Copper
Copper
Zinc
Zinc
Phosphorus
Phosphorus
Sodium
Sodium
Manganese
Manganese
Selenium
Selenium
25%
35%
12%
345%
1902%
2144%
83%
22%
77%
215%
4
100 g
300 g
3 oz - 85g 1 fillet - 154g
Magnesium
Magnesium
Calcium
Calcium
Potassium
Potassium
Iron
Iron
Copper
Copper
Zinc
Zinc
Phosphorus
Phosphorus
Sodium
Sodium
Manganese
Manganese
Selenium
Selenium
30%
9.9%
36%
18%
31%
35%
148%
8.5%
11%
88%
Vitamin Comparison
Vitamin comparison score is based on the number of vitamins by which one or the other food is richer. The "coverage" charts below show how much of the daily needs can be covered by 300 grams of the food.
4
100 g
300 g
6 medium - 42g 3 oz - 85g
Vitamin C
Vit. C
Vitamin D
Vit. D
Vitamin A
Vit. A
Vitamin E
Vit. E
Vitamin B1
Vit. B1
Vitamin B2
Vit. B2
Vitamin B3
Vit. B3
Vitamin B5
Vit. B5
Vitamin B6
Vit. B6
Vitamin B12
Vit. B12
Vitamin K
Vit. K
Folate
Folate
0%
0%
8.7%
34%
9%
42%
35%
27%
14%
2188%
5%
11%
6
100 g
300 g
3 oz - 85g 1 fillet - 154g
Vitamin C
Vit. C
Vitamin D
Vit. D
Vitamin A
Vit. A
Vitamin E
Vit. E
Vitamin B1
Vit. B1
Vitamin B2
Vit. B2
Vitamin B3
Vit. B3
Vitamin B5
Vit. B5
Vitamin B6
Vit. B6
Vitamin B12
Vit. B12
Vitamin K
Vit. K
Folate
Folate
0%
0%
13%
0%
43%
36%
72%
52%
80%
120%
0%
13%
All nutrients comparison - raw data values
Nutrient
DV% diff.
Zinc
78.6mg
1.27mg
703%
Vitamin B12
17.5µg
0.96µg
689%
Copper
5.707mg
0.092mg
624%
Iron
9.21mg
0.47mg
109%
Selenium
39.5µg
16.2µg
42%
Protein
11.42g
24.47g
26%
Choline
130mg
24%
Phosphorus
194mg
346mg
22%
Manganese
0.591mg
0.086mg
22%
Vitamin B6
0.061mg
0.346mg
22%
Vitamin B3
1.85mg
3.846mg
12%
Vitamin E
1.7mg
11%
Vitamin B1
0.036mg
0.171mg
11%
Polyunsaturated fat
1.056g
2.755g
11%
Calcium
116mg
33mg
8%
Potassium
139mg
406mg
8%
Vitamin B5
0.447mg
0.865mg
8%
Fats
3.42g
7.51g
6%
Monounsaturated fat
0.506g
2.559g
5%
Calories
102kcal
172kcal
4%
Sodium
166mg
65mg
4%
Carbs
5.45g
0g
2%
Magnesium
35mg
42mg
2%
Vitamin B2
0.18mg
0.154mg
2%
Vitamin K
2µg
2%
Cholesterol
79mg
77mg
1%
Vitamin A
26µg
39µg
1%
Folate
14µg
17µg
1%
Saturated fat
0.948g
1.162g
1%
Protein per 100 calories
11g
14g
N/A
Calories per 10 g protein
89kcal
70kcal
N/A
Weight per 100 calories
98g
58g
N/A
Unsaturated / Saturated Fat ratio
1.6
4.6
N/A
Net carbs
5.45g
0g
N/A
Vitamin D*
2 IU
0%
Sugar
1.23g
N/A
Starch
0.9g
0%
Trans fat
0.068g
N/A
Tryptophan
0.138mg
0.274mg
0%
Threonine
0.046mg
1.073mg
0%
Isoleucine
0.459mg
1.128mg
0%
Leucine
0.716mg
1.989mg
0%
Lysine
0.762mg
2.248mg
0%
Methionine
0.257mg
0.724mg
0%
Phenylalanine
0.413mg
0.955mg
0%
Valine
0.523mg
1.261mg
0%
Histidine
0.22mg
0.721mg
0%
Omega-3 - EPA
0.353g
0.406g
N/A
Omega-3 - DHA
0.271g
1.206g
N/A
Omega-3 - ALA
0.163g
N/A
Omega-3 - DPA
0.02g
0.209g
N/A
Omega-3 - Eicosatrienoic acid
0.004g
N/A
Omega-6 - Gamma-linoleic acid
0.004g
N/A
Omega-6 - Dihomo-gamma-linoleic acid
0.007g
N/A
Omega-6 - Eicosadienoic acid
0.007g
N/A
Omega-6 - Linoleic acid
0.061g
N/A
Macronutrient Comparison
Macronutrient breakdown side-by-side comparison
2
11%
3%
5%
78%
Protein:
11.42 g
Fats:
3.42 g
Carbs:
5.45 g
Water:
78.19 g
Other:
1.52 g
3
24%
8%
65%
3%
Protein:
24.47 g
Fats:
7.51 g
Carbs:
0 g
Water:
65.09 g
Other:
2.93 g
Contains
more
Carbs Carbs
+∞%
Contains
more
Water Water
+20.1%
Contains
more
Protein Protein
+114.3%
Contains
more
Fats Fats
+119.6%
Contains
more
Other Other
+92.8%
Fat Type Comparison
Fat type breakdown side-by-side comparison
1
38%
20%
42%
Saturated fat:
Sat. Fat
0.948 g
Monounsaturated fat:
Mono. Fat
0.506 g
Polyunsaturated fat:
Poly. Fat
1.056 g
2
18%
40%
43%
Saturated fat:
Sat. Fat
1.162 g
Monounsaturated fat:
Mono. Fat
2.559 g
Polyunsaturated fat:
Poly. Fat
2.755 g
Contains
less
Sat. Fat Saturated fat
-18.4%
Contains
more
Mono. Fat Monounsaturated fat
+405.7%
Contains
more
Poly. Fat Polyunsaturated fat
+160.9%