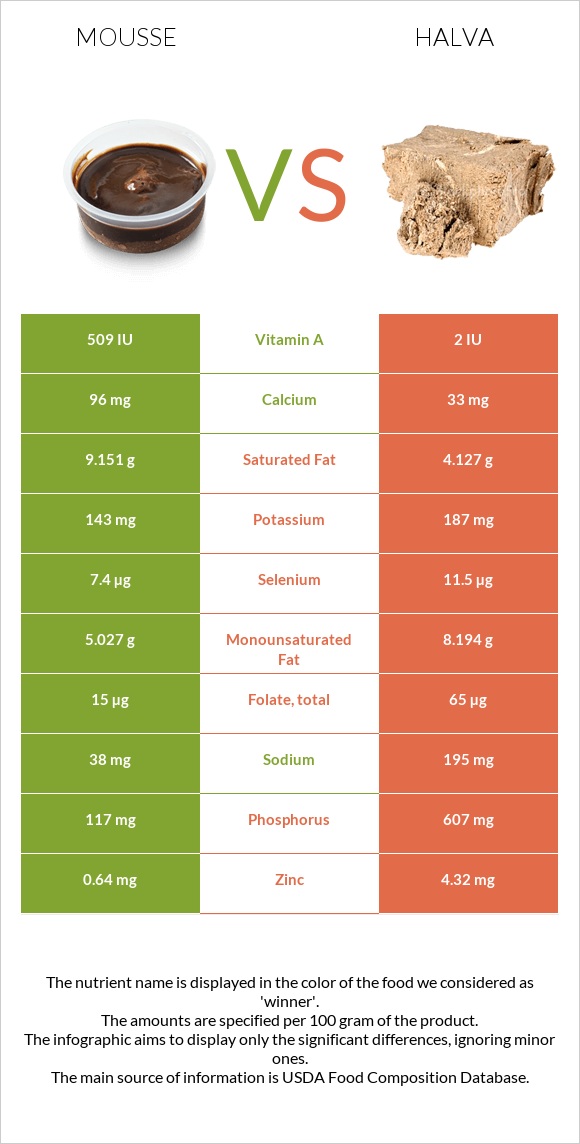
How are mousse and halva different? Halva has more copper, phosphorus, iron, magnesium, manganese, zinc, vitamin B1, and vitamin B6 than mousse. Daily need coverage for copper for halva is 125% higher. Mousse has a lower glycemic index (42) than halva (55). Desserts, mousse, chocolate, prepared-from-recipe and Candies, halavah, plain are the varieties used in this article.
Infographic
Mineral Comparison
Mineral comparison score is based on the number of minerals by which one or the other food is richer. The "coverage" charts below show how much of the daily needs can be covered by 300 grams of the food.
2
100 g
300 g
0.5 cup - 202g 1 recipe yield - 808g
Magnesium
Magnesium
Calcium
Calcium
Potassium
Potassium
Iron
Iron
Copper
Copper
Zinc
Zinc
Phosphorus
Phosphorus
Sodium
Sodium
Manganese
Manganese
Selenium
Selenium
14%
29%
13%
21%
25%
17%
50%
5%
7.7%
40%
8
100 g
300 g
1 oz - 28.35g
Magnesium
Magnesium
Calcium
Calcium
Potassium
Potassium
Iron
Iron
Copper
Copper
Zinc
Zinc
Phosphorus
Phosphorus
Sodium
Sodium
Manganese
Manganese
Selenium
Selenium
156%
9.9%
17%
170%
401%
118%
260%
25%
114%
63%
Vitamin Comparison
Vitamin comparison score is based on the number of vitamins by which one or the other food is richer. The "coverage" charts below show how much of the daily needs can be covered by 300 grams of the food.
6
100 g
300 g
0.5 cup - 202g 1 recipe yield - 808g
Vitamin C
Vit. C
Vitamin D
Vit. D
Vitamin A
Vit. A
Vitamin E
Vit. E
Vitamin B1
Vit. B1
Vitamin B2
Vit. B2
Vitamin B3
Vit. B3
Vitamin B5
Vit. B5
Vitamin B6
Vit. B6
Vitamin B12
Vit. B12
Vitamin K
Vit. K
Folate
Folate
0.33%
0%
47%
10%
11%
47%
2.7%
32%
13%
59%
4%
11%
4
100 g
300 g
1 oz - 28.35g
Vitamin C
Vit. C
Vitamin D
Vit. D
Vitamin A
Vit. A
Vitamin E
Vit. E
Vitamin B1
Vit. B1
Vitamin B2
Vit. B2
Vitamin B3
Vit. B3
Vitamin B5
Vit. B5
Vitamin B6
Vit. B6
Vitamin B12
Vit. B12
Vitamin K
Vit. K
Folate
Folate
0.33%
0%
0%
0%
106%
20%
54%
10%
80%
5%
0%
49%
All nutrients comparison - raw data values
Nutrient
DV% diff.
Copper
0.075mg
1.202mg
125%
Phosphorus
117mg
607mg
70%
Polyunsaturated fat
0.879g
8.481g
51%
Iron
0.55mg
4.53mg
50%
Cholesterol
140mg
0mg
47%
Magnesium
20mg
218mg
47%
Manganese
0.059mg
0.873mg
35%
Zinc
0.64mg
4.32mg
33%
Vitamin B1
0.045mg
0.424mg
32%
Saturated fat
9.151g
4.127g
23%
Vitamin B6
0.058mg
0.348mg
22%
Vitamin B12
0.47µg
0.04µg
18%
Protein
4.14g
12.49g
17%
Vitamin B3
0.146mg
2.856mg
17%
Fiber
0.6g
4.5g
16%
Vitamin A
140µg
0µg
16%
Carbs
16.07g
60.49g
15%
Folate
15µg
65µg
13%
Calories
225kcal
469kcal
12%
Vitamin B2
0.205mg
0.088mg
9%
Fats
16g
21.52g
8%
Monounsaturated fat
5.027g
8.194g
8%
Sodium
38mg
195mg
7%
Selenium
7.4µg
11.5µg
7%
Vitamin B5
0.533mg
0.174mg
7%
Calcium
96mg
33mg
6%
Vitamin E
0.51mg
3%
Caffeine
7mg
2%
Potassium
143mg
187mg
1%
Vitamin K
1.6µg
1%
Protein per 100 calories
1.8g
2.7g
N/A
Calories per 10 g protein
543kcal
376kcal
N/A
Weight per 100 calories
44g
21g
N/A
Unsaturated / Saturated Fat ratio
0.65
4
N/A
Vitamin C
0.1mg
0.1mg
0%
Net carbs
15.47g
55.99g
N/A
Sugar
14.81g
N/A
Omega-3 - EPA
0.001g
0g
N/A
Omega-3 - DHA
0.01g
0g
N/A
Macronutrient Comparison
Macronutrient breakdown side-by-side comparison
1
4%
16%
16%
63%
Protein:
4.14 g
Fats:
16 g
Carbs:
16.07 g
Water:
62.94 g
Other:
0.85 g
4
12%
22%
60%
4%
2%
Protein:
12.49 g
Fats:
21.52 g
Carbs:
60.49 g
Water:
3.67 g
Other:
1.83 g
Contains
more
Water Water
+1615%
Contains
more
Protein Protein
+201.7%
Contains
more
Fats Fats
+34.5%
Contains
more
Carbs Carbs
+276.4%
Contains
more
Other Other
+115.3%
Fat Type Comparison
Fat type breakdown side-by-side comparison
0
61%
33%
6%
Saturated fat:
Sat. Fat
9.151 g
Monounsaturated fat:
Mono. Fat
5.027 g
Polyunsaturated fat:
Poly. Fat
0.879 g
3
20%
39%
41%
Saturated fat:
Sat. Fat
4.127 g
Monounsaturated fat:
Mono. Fat
8.194 g
Polyunsaturated fat:
Poly. Fat
8.481 g
Contains
less
Sat. Fat Saturated fat
-54.9%
Contains
more
Mono. Fat Monounsaturated fat
+63%
Contains
more
Poly. Fat Polyunsaturated fat
+864.8%