Shiitake vs. Raspberry — In-Depth Nutrition Comparison
Compare
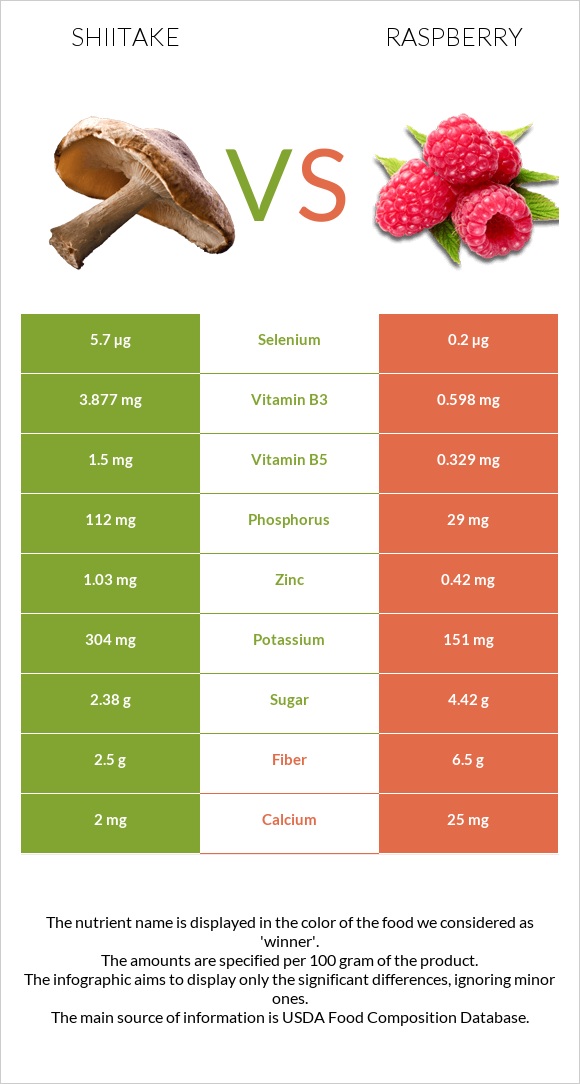
Significant differences between shiitake and raspberries
- Shiitake has more vitamin B5, vitamin B3, vitamin B6, vitamin B2, phosphorus, selenium, copper, and zinc; however, raspberries are richer in manganese and fiber.
- Shiitake covers your daily vitamin B5 needs 23% more than raspberries.
- Raspberries have 29 times less selenium than shiitake. Shiitake has 5.7µg of selenium, while raspberries have 0.2µg.
Specific food types used in this comparison are Mushrooms, shiitake, raw and Raspberries, raw.
Infographic
Infographic link
Mineral Comparison
Mineral comparison score is based on the number of minerals by which one or the other food is richer. The "coverage" charts below show how much of the daily needs can be covered by 300 grams of the food.
| Contains more PotassiumPotassium | +101.3% |
| Contains more CopperCopper | +57.8% |
| Contains more ZincZinc | +145.2% |
| Contains more PhosphorusPhosphorus | +286.2% |
| Contains more SeleniumSelenium | +2750% |
| Contains more CalciumCalcium | +1150% |
| Contains more IronIron | +68.3% |
| Contains less SodiumSodium | -88.9% |
| Contains more ManganeseManganese | +191.3% |
Vitamin Comparison
Vitamin comparison score is based on the number of vitamins by which one or the other food is richer. The "coverage" charts below show how much of the daily needs can be covered by 300 grams of the food.
| Contains more Vitamin DVitamin D | +∞% |
| Contains more Vitamin B2Vitamin B2 | +471.1% |
| Contains more Vitamin B3Vitamin B3 | +548.3% |
| Contains more Vitamin B5Vitamin B5 | +355.9% |
| Contains more Vitamin B6Vitamin B6 | +432.7% |
| Contains more Vitamin B1Vitamin B1 | +113.3% |
| Contains more FolateFolate | +61.5% |
All nutrients comparison - raw data values
| Nutrient |  |
 |
DV% diff. |
| Vitamin C | 26.2mg | 29% | |
| Vitamin B5 | 1.5mg | 0.329mg | 23% |
| Vitamin B3 | 3.877mg | 0.598mg | 20% |
| Manganese | 0.23mg | 0.67mg | 19% |
| Vitamin B6 | 0.293mg | 0.055mg | 18% |
| Fiber | 2.5g | 6.5g | 16% |
| Vitamin B2 | 0.217mg | 0.038mg | 14% |
| Phosphorus | 112mg | 29mg | 12% |
| Selenium | 5.7µg | 0.2µg | 10% |
| Vitamin K | 7.8µg | 7% | |
| Copper | 0.142mg | 0.09mg | 6% |
| Zinc | 1.03mg | 0.42mg | 6% |
| Vitamin E | 0.87mg | 6% | |
| Potassium | 304mg | 151mg | 5% |
| Iron | 0.41mg | 0.69mg | 4% |
| Polyunsaturated fat | 0.375g | 3% | |
| Fructose | 0g | 2.35g | 3% |
| Protein | 2.24g | 1.2g | 2% |
| Carbs | 6.79g | 11.94g | 2% |
| Vitamin D | 18 IU | 0 IU | 2% |
| Calcium | 2mg | 25mg | 2% |
| Vitamin D | 0.4µg | 0µg | 2% |
| Folate | 13µg | 21µg | 2% |
| Choline | 12.3mg | 2% | |
| Calories | 34kcal | 52kcal | 1% |
| Vitamin B1 | 0.015mg | 0.032mg | 1% |
| Fats | 0.49g | 0.65g | 0% |
| Net carbs | 4.29g | 5.44g | N/A |
| Magnesium | 20mg | 22mg | 0% |
| Sugar | 2.38g | 4.42g | N/A |
| Sodium | 9mg | 1mg | 0% |
| Vitamin A | 2µg | 0% | |
| Saturated fat | 0.019g | 0% | |
| Monounsaturated fat | 0.064g | 0% | |
| Tryptophan | 0.011mg | 0% | |
| Threonine | 0.134mg | 0% | |
| Isoleucine | 0.111mg | 0% | |
| Leucine | 0.189mg | 0% | |
| Lysine | 0.134mg | 0% | |
| Methionine | 0.033mg | 0% | |
| Phenylalanine | 0.111mg | 0% | |
| Valine | 0.145mg | 0% | |
| Histidine | 0.056mg | 0% |
Macronutrient Comparison
Macronutrient breakdown side-by-side comparison
| Contains more ProteinProtein | +86.7% |
| Contains more OtherOther | +60.9% |
| Contains more FatsFats | +32.7% |
| Contains more CarbsCarbs | +75.8% |
~equal in
Water
~85.75g
Carbohydrate type comparison
Carbohydrate type breakdown side-by-side comparison
| Contains more GlucoseGlucose | +28% |
| Contains more SucroseSucrose | +∞% |
| Contains more FructoseFructose | +∞% |
~equal in
Starch
~0g
~equal in
Lactose
~0g
~equal in
Maltose
~0g
~equal in
Galactose
~0g


