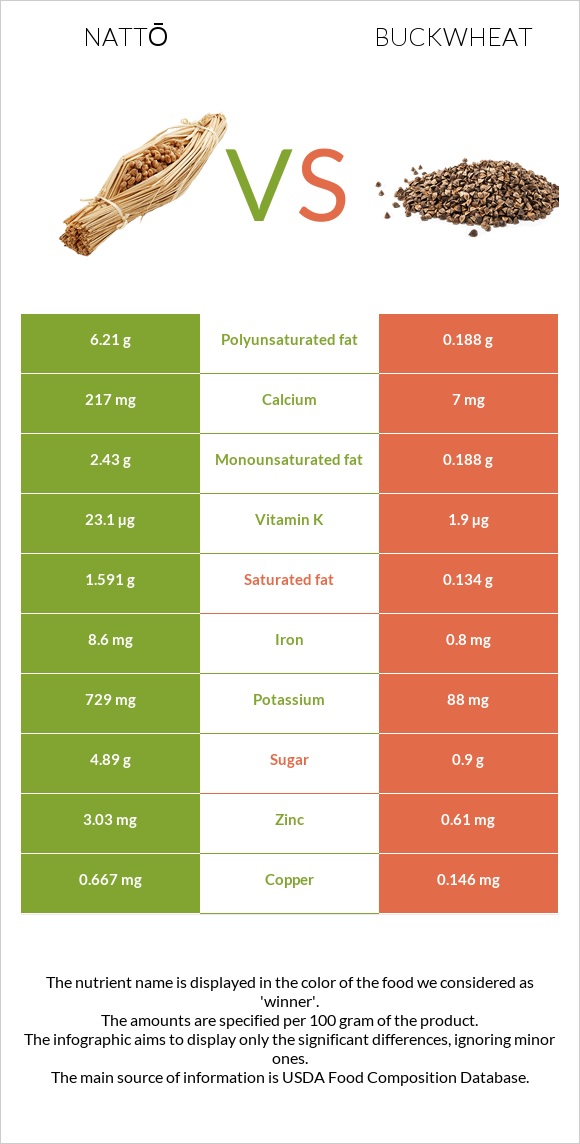
Summary of differences between nattō and buckwheat The amount of iron, copper, manganese, zinc, calcium, potassium, vitamin K, magnesium, phosphorus, and vitamin C in nattō is higher than in buckwheat. Nattō covers your daily need for iron, 98% more than buckwheat. These are the specific foods used in this comparison Natto and Buckwheat groats, roasted, cooked .
Infographic
Mineral Comparison
Mineral comparison score is based on the number of minerals by which one or the other food is richer. The "coverage" charts below show how much of the daily needs can be covered by 300 grams of the food.
9
100 g
300 g
1 cup - 175g
Magnesium
Magnesium
Calcium
Calcium
Potassium
Potassium
Iron
Iron
Copper
Copper
Zinc
Zinc
Phosphorus
Phosphorus
Sodium
Sodium
Manganese
Manganese
Selenium
Selenium
82%
65%
64%
323%
222%
83%
75%
0.91%
199%
48%
1
100 g
300 g
1 cup - 168g
Magnesium
Magnesium
Calcium
Calcium
Potassium
Potassium
Iron
Iron
Copper
Copper
Zinc
Zinc
Phosphorus
Phosphorus
Sodium
Sodium
Manganese
Manganese
Selenium
Selenium
36%
2.1%
7.8%
30%
49%
17%
30%
0.52%
53%
12%
Vitamin Comparison
Vitamin comparison score is based on the number of vitamins by which one or the other food is richer. The "coverage" charts below show how much of the daily needs can be covered by 300 grams of the food.
5
100 g
300 g
1 cup - 175g
Vitamin C
Vit. C
Vitamin D
Vit. D
Vitamin A
Vit. A
Vitamin E
Vit. E
Vitamin B1
Vit. B1
Vitamin B2
Vit. B2
Vitamin B3
Vit. B3
Vitamin B5
Vit. B5
Vitamin B6
Vit. B6
Vitamin B12
Vit. B12
Vitamin K
Vit. K
Folate
Folate
43%
0%
0%
0.2%
40%
44%
0%
13%
30%
0%
58%
6%
4
100 g
300 g
1 cup - 168g
Vitamin C
Vit. C
Vitamin D
Vit. D
Vitamin A
Vit. A
Vitamin E
Vit. E
Vitamin B1
Vit. B1
Vitamin B2
Vit. B2
Vitamin B3
Vit. B3
Vitamin B5
Vit. B5
Vitamin B6
Vit. B6
Vitamin B12
Vit. B12
Vitamin K
Vit. K
Folate
Folate
0%
0%
0%
1.8%
10%
9%
18%
22%
18%
0%
4.8%
11%
All nutrients comparison - raw data values
Nutrient
DV% diff.
Iron
8.6mg
0.8mg
98%
Copper
0.667mg
0.146mg
58%
Manganese
1.528mg
0.403mg
49%
Polyunsaturated fat
6.21g
0.188g
40%
Protein
19.4g
3.38g
32%
Zinc
3.03mg
0.61mg
22%
Calcium
217mg
7mg
21%
Potassium
729mg
88mg
19%
Vitamin K
23.1µg
1.9µg
18%
Fats
11g
0.62g
16%
Magnesium
115mg
51mg
15%
Phosphorus
174mg
70mg
15%
Vitamin C
13mg
0mg
14%
Selenium
8.8µg
2.2µg
12%
Vitamin B2
0.19mg
0.039mg
12%
Fiber
5.4g
2.7g
11%
Vitamin B1
0.16mg
0.04mg
10%
Choline
57mg
20.1mg
7%
Saturated fat
1.591g
0.134g
7%
Calories
211kcal
92kcal
6%
Vitamin B3
0mg
0.94mg
6%
Monounsaturated fat
2.43g
0.188g
6%
Vitamin B6
0.13mg
0.077mg
4%
Vitamin B5
0.215mg
0.359mg
3%
Carbs
12.68g
19.94g
2%
Folate
8µg
14µg
2%
Vitamin E
0.01mg
0.09mg
1%
Protein per 100 calories
9.2g
3.7g
N/A
Calories per 10 g protein
109kcal
272kcal
N/A
Weight per 100 calories
47g
109g
N/A
Unsaturated / Saturated Fat ratio
5.4
2.8
N/A
Net carbs
7.28g
17.24g
N/A
Sugar
4.89g
0.9g
N/A
Sodium
7mg
4mg
0%
Tryptophan
0.223mg
0.049mg
0%
Threonine
0.813mg
0.129mg
0%
Isoleucine
0.931mg
0.127mg
0%
Leucine
1.509mg
0.212mg
0%
Lysine
1.145mg
0.172mg
0%
Methionine
0.208mg
0.044mg
0%
Phenylalanine
0.941mg
0.133mg
0%
Valine
1.018mg
0.173mg
0%
Histidine
0.512mg
0.079mg
0%
Fructose
0.1g
0%
Macronutrient Comparison
Macronutrient breakdown side-by-side comparison
3
19%
11%
13%
55%
2%
Protein:
19.4 g
Fats:
11 g
Carbs:
12.68 g
Water:
55.02 g
Other:
1.9 g
2
3%
20%
76%
Protein:
3.38 g
Fats:
0.62 g
Carbs:
19.94 g
Water:
75.63 g
Other:
0.43 g
Contains
more
Protein Protein
+474%
Contains
more
Fats Fats
+1674.2%
Contains
more
Other Other
+341.9%
Contains
more
Carbs Carbs
+57.3%
Contains
more
Water Water
+37.5%
Fat Type Comparison
Fat type breakdown side-by-side comparison
2
16%
24%
61%
Saturated fat:
Sat. Fat
1.591 g
Monounsaturated fat:
Mono. Fat
2.43 g
Polyunsaturated fat:
Poly. Fat
6.21 g
1
26%
37%
37%
Saturated fat:
Sat. Fat
0.134 g
Monounsaturated fat:
Mono. Fat
0.188 g
Polyunsaturated fat:
Poly. Fat
0.188 g
Contains
more
Mono. Fat Monounsaturated fat
+1192.6%
Contains
more
Poly. Fat Polyunsaturated fat
+3203.2%
Contains
less
Sat. Fat Saturated fat
-91.6%