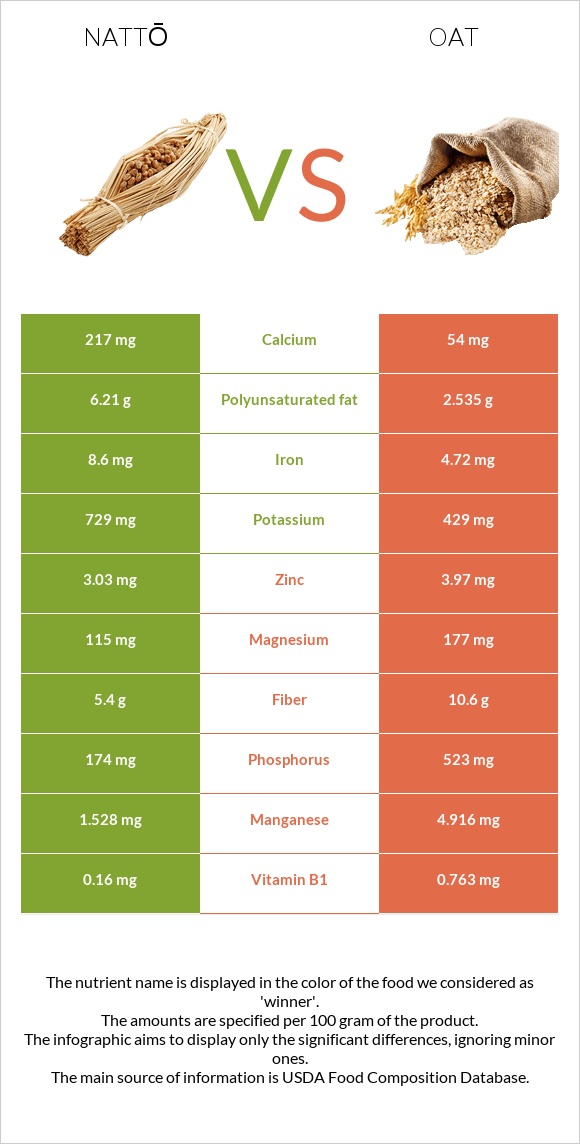
Differences between nattō and oats Nattō has more iron, calcium, and vitamin C, while oats have more manganese, vitamin B1, phosphorus, vitamin B5, fiber, magnesium, and folate. Oats' daily need coverage for manganese is 147% higher. The food types used in this comparison are Natto and Oats .
Infographic
Mineral Comparison
Mineral comparison score is based on the number of minerals by which one or the other food is richer. The "coverage" charts below show how much of the daily needs can be covered by 300 grams of the food.
4
100 g
300 g
1 cup - 175g
Magnesium
Magnesium
Calcium
Calcium
Potassium
Potassium
Iron
Iron
Copper
Copper
Zinc
Zinc
Phosphorus
Phosphorus
Sodium
Sodium
Manganese
Manganese
Selenium
Selenium
82%
65%
64%
323%
222%
83%
75%
0.91%
199%
48%
5
100 g
300 g
1 cup - 156g
Magnesium
Magnesium
Calcium
Calcium
Potassium
Potassium
Iron
Iron
Copper
Copper
Zinc
Zinc
Phosphorus
Phosphorus
Sodium
Sodium
Manganese
Manganese
Selenium
Selenium
126%
16%
38%
177%
209%
108%
224%
0.26%
641%
0%
Vitamin Comparison
Vitamin comparison score is based on the number of vitamins by which one or the other food is richer. The "coverage" charts below show how much of the daily needs can be covered by 300 grams of the food.
4
100 g
300 g
1 cup - 175g
Vitamin C
Vit. C
Vitamin D
Vit. D
Vitamin A
Vit. A
Vitamin E
Vit. E
Vitamin B1
Vit. B1
Vitamin B2
Vit. B2
Vitamin B3
Vit. B3
Vitamin B5
Vit. B5
Vitamin B6
Vit. B6
Vitamin B12
Vit. B12
Vitamin K
Vit. K
Folate
Folate
43%
0%
0%
0.2%
40%
44%
0%
13%
30%
0%
58%
6%
4
100 g
300 g
1 cup - 156g
Vitamin C
Vit. C
Vitamin D
Vit. D
Vitamin A
Vit. A
Vitamin E
Vit. E
Vitamin B1
Vit. B1
Vitamin B2
Vit. B2
Vitamin B3
Vit. B3
Vitamin B5
Vit. B5
Vitamin B6
Vit. B6
Vitamin B12
Vit. B12
Vitamin K
Vit. K
Folate
Folate
0%
0%
0%
0%
191%
32%
18%
81%
27%
0%
0%
42%
All nutrients comparison - raw data values
Nutrient
DV% diff.
Manganese
1.528mg
4.916mg
147%
Phosphorus
174mg
523mg
50%
Vitamin B1
0.16mg
0.763mg
50%
Iron
8.6mg
4.72mg
49%
Polyunsaturated fat
6.21g
2.535g
25%
Vitamin B5
0.215mg
1.349mg
23%
Fiber
5.4g
10.6g
21%
Vitamin K
23.1µg
19%
Carbs
12.68g
66.27g
18%
Calcium
217mg
54mg
16%
Selenium
8.8µg
16%
Magnesium
115mg
177mg
15%
Vitamin C
13mg
0mg
14%
Folate
8µg
56µg
12%
Choline
57mg
10%
Calories
211kcal
389kcal
9%
Potassium
729mg
429mg
9%
Zinc
3.03mg
3.97mg
9%
Fats
11g
6.9g
6%
Vitamin B3
0mg
0.961mg
6%
Protein
19.4g
16.89g
5%
Copper
0.667mg
0.626mg
5%
Vitamin B2
0.19mg
0.139mg
4%
Saturated fat
1.591g
1.217g
2%
Vitamin B6
0.13mg
0.119mg
1%
Monounsaturated fat
2.43g
2.178g
1%
Protein per 100 calories
9.2g
4.3g
N/A
Calories per 10 g protein
109kcal
230kcal
N/A
Weight per 100 calories
47g
26g
N/A
Unsaturated / Saturated Fat ratio
5.4
3.9
N/A
Net carbs
7.28g
55.67g
N/A
Sugar
4.89g
N/A
Sodium
7mg
2mg
0%
Vitamin E
0.01mg
0%
Tryptophan
0.223mg
0.234mg
0%
Threonine
0.813mg
0.575mg
0%
Isoleucine
0.931mg
0.694mg
0%
Leucine
1.509mg
1.284mg
0%
Lysine
1.145mg
0.701mg
0%
Methionine
0.208mg
0.312mg
0%
Phenylalanine
0.941mg
0.895mg
0%
Valine
1.018mg
0.937mg
0%
Histidine
0.512mg
0.405mg
0%
Macronutrient Comparison
Macronutrient breakdown side-by-side comparison
4
19%
11%
13%
55%
2%
Protein:
19.4 g
Fats:
11 g
Carbs:
12.68 g
Water:
55.02 g
Other:
1.9 g
1
17%
7%
66%
8%
2%
Protein:
16.89 g
Fats:
6.9 g
Carbs:
66.27 g
Water:
8.22 g
Other:
1.72 g
Contains
more
Protein Protein
+14.9%
Contains
more
Fats Fats
+59.4%
Contains
more
Water Water
+569.3%
Contains
more
Carbs Carbs
+422.6%
Fat Type Comparison
Fat type breakdown side-by-side comparison
2
16%
24%
61%
Saturated fat:
Sat. Fat
1.591 g
Monounsaturated fat:
Mono. Fat
2.43 g
Polyunsaturated fat:
Poly. Fat
6.21 g
1
21%
37%
43%
Saturated fat:
Sat. Fat
1.217 g
Monounsaturated fat:
Mono. Fat
2.178 g
Polyunsaturated fat:
Poly. Fat
2.535 g
Contains
more
Mono. Fat Monounsaturated fat
+11.6%
Contains
more
Poly. Fat Polyunsaturated fat
+145%
Contains
less
Sat. Fat Saturated fat
-23.5%