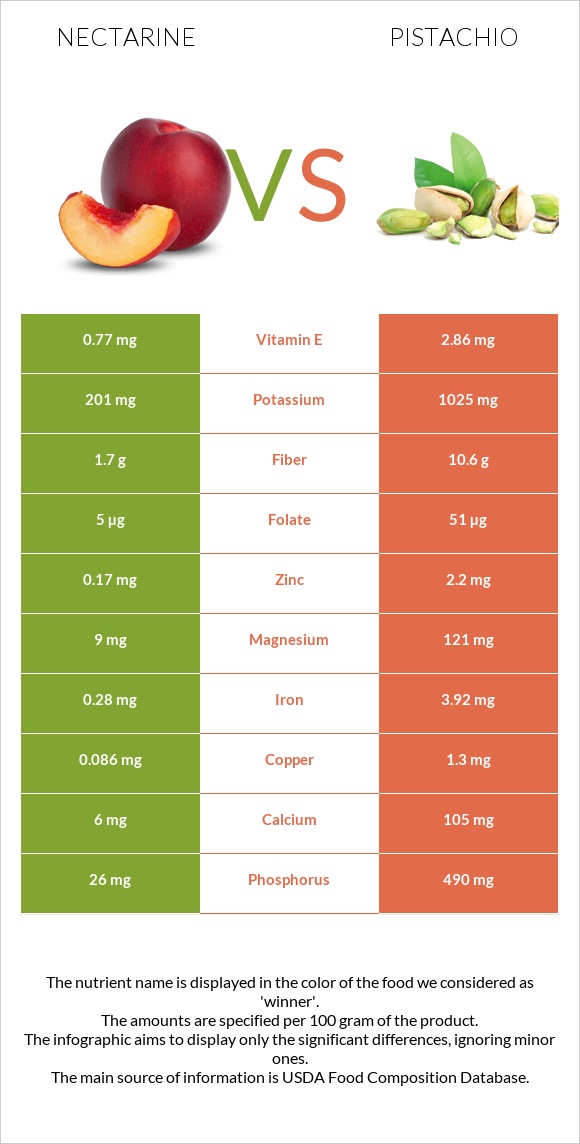
Important differences between nectarine and pistachios Pistachios have more copper, vitamin B6, vitamin B1, phosphorus, manganese, iron, fiber, magnesium, and potassium than nectarine. Pistachios' daily need coverage for copper is 135% more. Nectarine contains less saturated fat. Nectarine has a higher glycemic index. The glycemic index of nectarine is 43, while the glycemic index of pistachios is 28. The food varieties used in the comparison are Nectarines, raw and Nuts, pistachio nuts, raw .
Infographic
Mineral Comparison
Mineral comparison score is based on the number of minerals by which one or the other food is richer. The "coverage" charts below show how much of the daily needs can be covered by 300 grams of the food.
1
100 g
300 g
1 small (2-1/3" dia) - 129g 1 NLEA serving - 140g 1 medium (2-1/2" dia) - 142g 1 cup slices - 143g 1 large (2-3/4" dia) - 156g
Magnesium
Magnesium
Calcium
Calcium
Potassium
Potassium
Iron
Iron
Copper
Copper
Zinc
Zinc
Phosphorus
Phosphorus
Sodium
Sodium
Manganese
Manganese
Selenium
Selenium
6.4%
1.8%
18%
11%
29%
4.6%
11%
0%
7%
0%
9
100 g
300 g
1 kernel - 0.7g 1 oz (49 kernels) - 28.35g 1 cup - 123g
Magnesium
Magnesium
Calcium
Calcium
Potassium
Potassium
Iron
Iron
Copper
Copper
Zinc
Zinc
Phosphorus
Phosphorus
Sodium
Sodium
Manganese
Manganese
Selenium
Selenium
86%
32%
90%
147%
433%
60%
210%
0.13%
157%
38%
Vitamin Comparison
Vitamin comparison score is based on the number of vitamins by which one or the other food is richer. The "coverage" charts below show how much of the daily needs can be covered by 300 grams of the food.
1
100 g
300 g
1 small (2-1/3" dia) - 129g 1 NLEA serving - 140g 1 medium (2-1/2" dia) - 142g 1 cup slices - 143g 1 large (2-3/4" dia) - 156g
Vitamin C
Vit. C
Vitamin D
Vit. D
Vitamin A
Vit. A
Vitamin E
Vit. E
Vitamin B1
Vit. B1
Vitamin B2
Vit. B2
Vitamin B3
Vit. B3
Vitamin B5
Vit. B5
Vitamin B6
Vit. B6
Vitamin B12
Vit. B12
Vitamin K
Vit. K
Folate
Folate
18%
0%
5.7%
15%
8.5%
6.2%
21%
11%
5.8%
0%
5.5%
3.8%
8
100 g
300 g
1 kernel - 0.7g 1 oz (49 kernels) - 28.35g 1 cup - 123g
Vitamin C
Vit. C
Vitamin D
Vit. D
Vitamin A
Vit. A
Vitamin E
Vit. E
Vitamin B1
Vit. B1
Vitamin B2
Vit. B2
Vitamin B3
Vit. B3
Vitamin B5
Vit. B5
Vitamin B6
Vit. B6
Vitamin B12
Vit. B12
Vitamin K
Vit. K
Folate
Folate
19%
0%
8.7%
57%
218%
37%
24%
31%
392%
0%
0%
38%
All nutrients comparison - raw data values
Nutrient
DV% diff.
Copper
0.086mg
1.3mg
135%
Vitamin B6
0.025mg
1.7mg
129%
Polyunsaturated fat
0.113g
14.38g
95%
Vitamin B1
0.034mg
0.87mg
70%
Fats
0.32g
45.32g
69%
Phosphorus
26mg
490mg
66%
Monounsaturated fat
0.088g
23.257g
58%
Manganese
0.054mg
1.2mg
50%
Iron
0.28mg
3.92mg
46%
Protein
1.06g
20.16g
38%
Fiber
1.7g
10.6g
36%
Magnesium
9mg
121mg
27%
Saturated fat
0.025g
5.907g
27%
Calories
44kcal
560kcal
26%
Potassium
201mg
1025mg
24%
Zinc
0.17mg
2.2mg
18%
Vitamin E
0.77mg
2.86mg
14%
Selenium
0µg
7µg
13%
Folate
5µg
51µg
12%
Calcium
6mg
105mg
10%
Vitamin B2
0.027mg
0.16mg
10%
Vitamin B5
0.185mg
0.52mg
7%
Carbs
10.55g
27.17g
6%
Vitamin K
2.2µg
2%
Starch
0.07g
1.67g
1%
Vitamin A
17µg
26µg
1%
Vitamin B3
1.125mg
1.3mg
1%
Choline
6.2mg
1%
Fructose
1.37g
0.24g
1%
Protein per 100 calories
2.4g
3.6g
N/A
Calories per 10 g protein
415kcal
278kcal
N/A
Weight per 100 calories
227g
18g
N/A
Unsaturated / Saturated Fat ratio
8
6.4
N/A
Vitamin C
5.4mg
5.6mg
0%
Net carbs
8.85g
16.57g
N/A
Sugar
7.89g
7.66g
N/A
Sodium
0mg
1mg
0%
Tryptophan
0.005mg
0.251mg
0%
Threonine
0.009mg
0.684mg
0%
Isoleucine
0.009mg
0.917mg
0%
Leucine
0.014mg
1.604mg
0%
Lysine
0.016mg
1.138mg
0%
Methionine
0.006mg
0.36mg
0%
Phenylalanine
0.021mg
1.092mg
0%
Valine
0.013mg
1.249mg
0%
Histidine
0.008mg
0.512mg
0%
Omega-6 - Linoleic acid
14.091g
N/A
Macronutrient Comparison
Macronutrient breakdown side-by-side comparison
1
11%
88%
Protein:
1.06 g
Fats:
0.32 g
Carbs:
10.55 g
Water:
87.59 g
Other:
0.48 g
4
20%
45%
27%
4%
3%
Protein:
20.16 g
Fats:
45.32 g
Carbs:
27.17 g
Water:
4.37 g
Other:
2.98 g
Contains
more
Water Water
+1904.3%
Contains
more
Protein Protein
+1801.9%
Contains
more
Fats Fats
+14062.5%
Contains
more
Carbs Carbs
+157.5%
Contains
more
Other Other
+520.8%
Fat Type Comparison
Fat type breakdown side-by-side comparison
1
11%
39%
50%
Saturated fat:
Sat. Fat
0.025 g
Monounsaturated fat:
Mono. Fat
0.088 g
Polyunsaturated fat:
Poly. Fat
0.113 g
2
14%
53%
33%
Saturated fat:
Sat. Fat
5.907 g
Monounsaturated fat:
Mono. Fat
23.257 g
Polyunsaturated fat:
Poly. Fat
14.38 g
Contains
less
Sat. Fat Saturated fat
-99.6%
Contains
more
Mono. Fat Monounsaturated fat
+26328.4%
Contains
more
Poly. Fat Polyunsaturated fat
+12625.7%
Carbohydrate type comparison
Carbohydrate type breakdown side-by-side comparison
2
62%
20%
17%
Starch:
0.07 g
Sucrose:
4.87 g
Glucose:
1.57 g
Fructose:
1.37 g
Lactose:
0 g
Maltose:
0 g
Galactose:
0 g
3
18%
74%
3%
3%
2%
Starch:
1.67 g
Sucrose:
6.87 g
Glucose:
0.32 g
Fructose:
0.24 g
Lactose:
0 g
Maltose:
0.17 g
Galactose:
0 g
Contains
more
Glucose Glucose
+390.6%
Contains
more
Fructose Fructose
+470.8%
Contains
more
Starch Starch
+2285.7%
Contains
more
Sucrose Sucrose
+41.1%
Contains
more
Maltose Maltose
+∞%
~equal in
Lactose
~0g
~equal in
Galactose
~0g