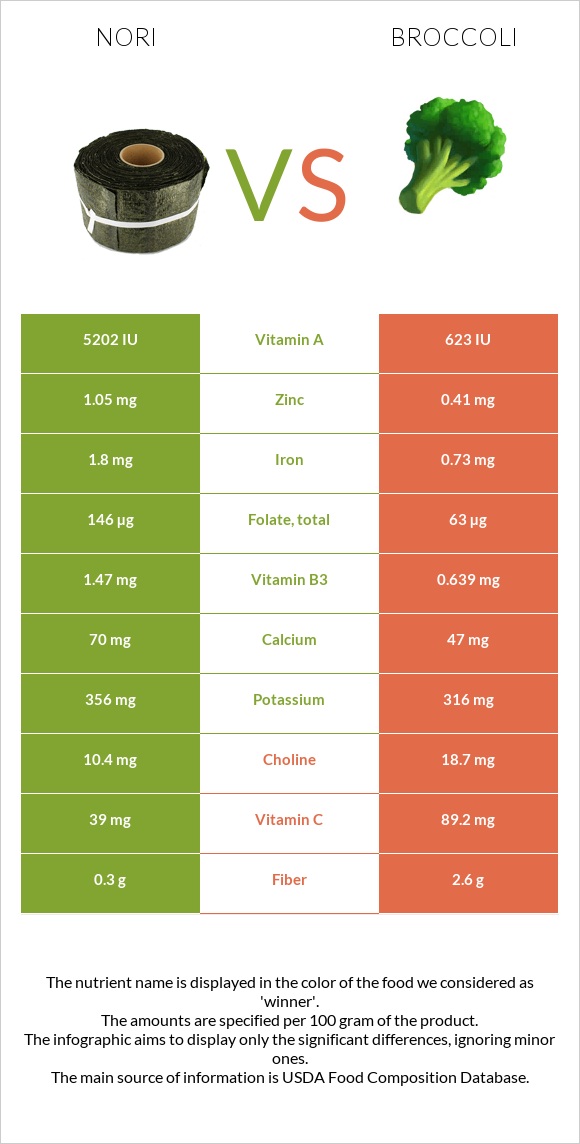
What are the main differences between nori and broccoli? Nori is richer in vitamin A, manganese, vitamin B2, copper, folate, iron, and zinc, yet broccoli is richer in vitamin K, vitamin C, and fiber. Nori's daily need coverage for vitamin A is 92% higher. Nori has 5 times more copper than broccoli. Nori has 0.264mg of copper, while broccoli has 0.049mg. We used Seaweed, laver, raw and Broccoli, raw types in this comparison.
Infographic
Mineral Comparison
Mineral comparison score is based on the number of minerals by which one or the other food is richer. The "coverage" charts below show how much of the daily needs can be covered by 300 grams of the food.
6
100 g
300 g
2 tbsp (1/8 cup) - 10g 10 sheets - 26g
Magnesium
Magnesium
Calcium
Calcium
Potassium
Potassium
Iron
Iron
Copper
Copper
Zinc
Zinc
Phosphorus
Phosphorus
Sodium
Sodium
Manganese
Manganese
Selenium
Selenium
1.4%
21%
31%
68%
88%
29%
25%
6.3%
129%
3.8%
4
100 g
300 g
1 spear (about 5" long) - 31g 0.5 cup, chopped or diced - 44g 1 cup chopped - 91g 1 NLEA serving - 148g 1 stalk - 151g 1 bunch - 608g
Magnesium
Magnesium
Calcium
Calcium
Potassium
Potassium
Iron
Iron
Copper
Copper
Zinc
Zinc
Phosphorus
Phosphorus
Sodium
Sodium
Manganese
Manganese
Selenium
Selenium
15%
14%
28%
27%
16%
11%
28%
4.3%
27%
14%
Vitamin Comparison
Vitamin comparison score is based on the number of vitamins by which one or the other food is richer. The "coverage" charts below show how much of the daily needs can be covered by 300 grams of the food.
6
100 g
300 g
2 tbsp (1/8 cup) - 10g 10 sheets - 26g
Vitamin C
Vit. C
Vitamin D
Vit. D
Vitamin A
Vit. A
Vitamin E
Vit. E
Vitamin B1
Vit. B1
Vitamin B2
Vit. B2
Vitamin B3
Vit. B3
Vitamin B5
Vit. B5
Vitamin B6
Vit. B6
Vitamin B12
Vit. B12
Vitamin K
Vit. K
Folate
Folate
130%
0%
87%
20%
25%
103%
28%
31%
37%
0%
10%
110%
3
100 g
300 g
1 spear (about 5" long) - 31g 0.5 cup, chopped or diced - 44g 1 cup chopped - 91g 1 NLEA serving - 148g 1 stalk - 151g 1 bunch - 608g
Vitamin C
Vit. C
Vitamin D
Vit. D
Vitamin A
Vit. A
Vitamin E
Vit. E
Vitamin B1
Vit. B1
Vitamin B2
Vit. B2
Vitamin B3
Vit. B3
Vitamin B5
Vit. B5
Vitamin B6
Vit. B6
Vitamin B12
Vit. B12
Vitamin K
Vit. K
Folate
Folate
297%
0%
10%
16%
18%
27%
12%
34%
40%
0%
254%
47%
All nutrients comparison - raw data values
Nutrient
DV% diff.
Vitamin K
4µg
101.6µg
81%
Vitamin C
39mg
89.2mg
56%
Manganese
0.988mg
0.21mg
34%
Vitamin A
260µg
31µg
25%
Vitamin B2
0.446mg
0.117mg
25%
Copper
0.264mg
0.049mg
24%
Folate
146µg
63µg
21%
Iron
1.8mg
0.73mg
13%
Fiber
0.3g
2.6g
9%
Protein
5.81g
2.82g
6%
Zinc
1.05mg
0.41mg
6%
Magnesium
2mg
21mg
5%
Vitamin B3
1.47mg
0.639mg
5%
Selenium
0.7µg
2.5µg
3%
Calcium
70mg
47mg
2%
Vitamin B1
0.098mg
0.071mg
2%
Choline
10.4mg
18.7mg
2%
Carbs
5.11g
6.64g
1%
Potassium
356mg
316mg
1%
Phosphorus
58mg
66mg
1%
Sodium
48mg
33mg
1%
Vitamin E
1mg
0.78mg
1%
Vitamin B5
0.521mg
0.573mg
1%
Vitamin B6
0.159mg
0.175mg
1%
Fructose
0.68g
1%
Calories
35kcal
34kcal
0%
Protein per 100 calories
17g
8.3g
N/A
Calories per 10 g protein
60kcal
121kcal
N/A
Weight per 100 calories
286g
294g
N/A
Fats
0.28g
0.37g
0%
Net carbs
4.81g
4.04g
N/A
Sugar
0.49g
1.7g
N/A
Saturated fat
0.061g
0.039g
0%
Monounsaturated fat
0.025g
0.011g
0%
Polyunsaturated fat
0.11g
0.038g
0%
Tryptophan
0.043mg
0.033mg
0%
Threonine
0.232mg
0.088mg
0%
Isoleucine
0.259mg
0.079mg
0%
Leucine
0.501mg
0.129mg
0%
Lysine
0.222mg
0.135mg
0%
Methionine
0.145mg
0.038mg
0%
Phenylalanine
0.273mg
0.117mg
0%
Valine
0.402mg
0.125mg
0%
Histidine
0.14mg
0.059mg
0%
Omega-3 - EPA
0.08g
0g
N/A
Macronutrient Comparison
Macronutrient breakdown side-by-side comparison
2
6%
5%
85%
4%
Protein:
5.81 g
Fats:
0.28 g
Carbs:
5.11 g
Water:
85.03 g
Other:
3.77 g
3
3%
7%
89%
Protein:
2.82 g
Fats:
0.37 g
Carbs:
6.64 g
Water:
89.3 g
Other:
0.87 g
Contains
more
Protein Protein
+106%
Contains
more
Other Other
+333.3%
Contains
more
Fats Fats
+32.1%
Contains
more
Carbs Carbs
+29.9%
Fat Type Comparison
Fat type breakdown side-by-side comparison
2
31%
13%
56%
Saturated fat:
Sat. Fat
0.061 g
Monounsaturated fat:
Mono. Fat
0.025 g
Polyunsaturated fat:
Poly. Fat
0.11 g
1
44%
13%
43%
Saturated fat:
Sat. Fat
0.039 g
Monounsaturated fat:
Mono. Fat
0.011 g
Polyunsaturated fat:
Poly. Fat
0.038 g
Contains
more
Mono. Fat Monounsaturated fat
+127.3%
Contains
more
Poly. Fat Polyunsaturated fat
+189.5%
Contains
less
Sat. Fat Saturated fat
-36.1%