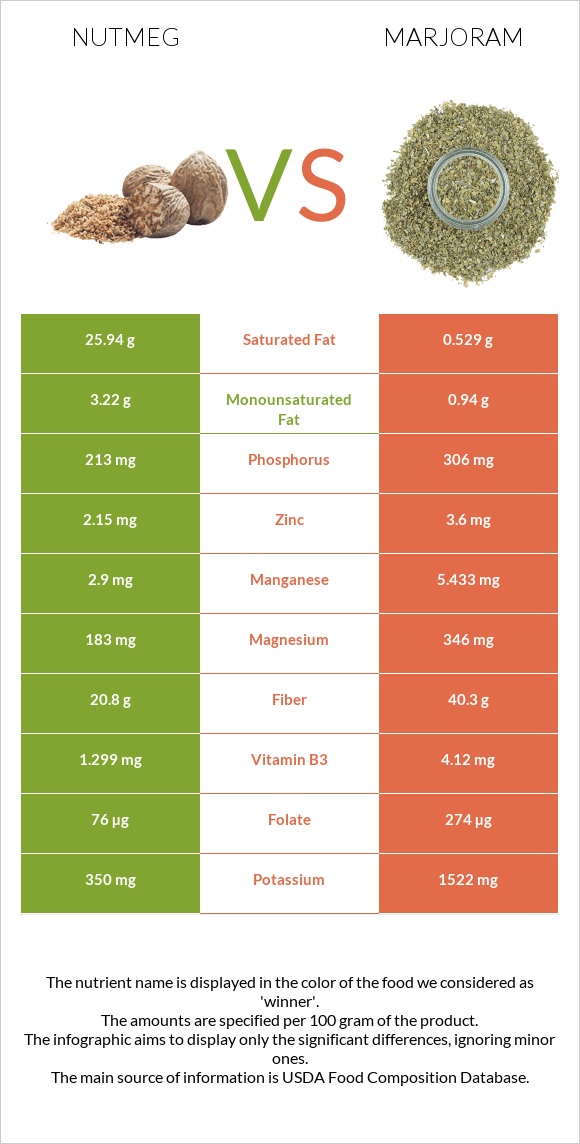
How are nutmeg and marjoram different? Marjoram is higher than nutmeg in iron, vitamin K, calcium, vitamin A, manganese, vitamin B6, fiber, vitamin C, and folate. Marjoram covers your daily need for iron, 996% more than nutmeg. Nutmeg contains 49 times more saturated fat than marjoram. Nutmeg contains 25.94g of saturated fat, while marjoram contains 0.529g. Spices, nutmeg, ground and Spices, marjoram, dried types were used in this article.
Infographic
Mineral Comparison
Mineral comparison score is based on the number of minerals by which one or the other food is richer. The "coverage" charts below show how much of the daily needs can be covered by 300 grams of the food.
1
100 g
300 g
0.25 tsp - 0.5g 1 tbsp - 7g
Magnesium
Magnesium
Calcium
Calcium
Potassium
Potassium
Iron
Iron
Copper
Copper
Zinc
Zinc
Phosphorus
Phosphorus
Sodium
Sodium
Manganese
Manganese
Selenium
Selenium
131%
55%
31%
114%
342%
59%
91%
2.1%
378%
8.7%
9
100 g
300 g
1 tsp - 0.6g 1 tbsp - 1.7g
Magnesium
Magnesium
Calcium
Calcium
Potassium
Potassium
Iron
Iron
Copper
Copper
Zinc
Zinc
Phosphorus
Phosphorus
Sodium
Sodium
Manganese
Manganese
Selenium
Selenium
247%
597%
134%
3102%
378%
98%
131%
10%
709%
25%
Vitamin Comparison
Vitamin comparison score is based on the number of vitamins by which one or the other food is richer. The "coverage" charts below show how much of the daily needs can be covered by 300 grams of the food.
1
100 g
300 g
0.25 tsp - 0.5g 1 tbsp - 7g
Vitamin C
Vit. C
Vitamin D
Vit. D
Vitamin A
Vit. A
Vitamin E
Vit. E
Vitamin B1
Vit. B1
Vitamin B2
Vit. B2
Vitamin B3
Vit. B3
Vitamin B5
Vit. B5
Vitamin B6
Vit. B6
Vitamin B12
Vit. B12
Vitamin K
Vit. K
Folate
Folate
10%
0%
1.7%
0%
87%
13%
24%
0%
37%
0%
0%
57%
8
100 g
300 g
1 tsp - 0.6g 1 tbsp - 1.7g
Vitamin C
Vit. C
Vitamin D
Vit. D
Vitamin A
Vit. A
Vitamin E
Vit. E
Vitamin B1
Vit. B1
Vitamin B2
Vit. B2
Vitamin B3
Vit. B3
Vitamin B5
Vit. B5
Vitamin B6
Vit. B6
Vitamin B12
Vit. B12
Vitamin K
Vit. K
Folate
Folate
171%
0%
134%
34%
72%
73%
77%
0%
275%
0%
1554%
206%
All nutrients comparison - raw data values
Nutrient
DV% diff.
Iron
3.04mg
82.71mg
996%
Vitamin K
0µg
621.7µg
518%
Calcium
184mg
1990mg
181%
Saturated fat
25.94g
0.529g
116%
Manganese
2.9mg
5.433mg
110%
Vitamin B6
0.16mg
1.19mg
79%
Fiber
20.8g
40.3g
78%
Vitamin C
3mg
51.4mg
54%
Folate
76µg
274µg
50%
Fats
36.31g
7.04g
45%
Vitamin A
5µg
403µg
44%
Magnesium
183mg
346mg
39%
Potassium
350mg
1522mg
34%
Polyunsaturated fat
0.35g
4.405g
27%
Vitamin B2
0.057mg
0.316mg
20%
Vitamin B3
1.299mg
4.12mg
18%
Protein
5.84g
12.66g
14%
Calories
525kcal
271kcal
13%
Zinc
2.15mg
3.6mg
13%
Phosphorus
213mg
306mg
13%
Copper
1.027mg
1.133mg
12%
Vitamin E
0mg
1.69mg
11%
Choline
8.8mg
43.6mg
6%
Monounsaturated fat
3.22g
0.94g
6%
Selenium
1.6µg
4.5µg
5%
Vitamin B1
0.346mg
0.289mg
5%
Carbs
49.29g
60.56g
4%
Sodium
16mg
77mg
3%
Protein per 100 calories
1.1g
4.7g
N/A
Calories per 10 g protein
899kcal
214kcal
N/A
Weight per 100 calories
19g
37g
N/A
Unsaturated / Saturated Fat ratio
0.14
10
N/A
Net carbs
28.49g
20.26g
N/A
Sugar
2.99g
4.09g
N/A
Macronutrient Comparison
Macronutrient breakdown side-by-side comparison
1
6%
36%
49%
6%
2%
Protein:
5.84 g
Fats:
36.31 g
Carbs:
49.29 g
Water:
6.23 g
Other:
2.33 g
4
13%
7%
61%
8%
12%
Protein:
12.66 g
Fats:
7.04 g
Carbs:
60.56 g
Water:
7.64 g
Other:
12.1 g
Contains
more
Fats Fats
+415.8%
Contains
more
Protein Protein
+116.8%
Contains
more
Carbs Carbs
+22.9%
Contains
more
Water Water
+22.6%
Contains
more
Other Other
+419.3%
Fat Type Comparison
Fat type breakdown side-by-side comparison
1
88%
11%
Saturated fat:
Sat. Fat
25.94 g
Monounsaturated fat:
Mono. Fat
3.22 g
Polyunsaturated fat:
Poly. Fat
0.35 g
2
9%
16%
75%
Saturated fat:
Sat. Fat
0.529 g
Monounsaturated fat:
Mono. Fat
0.94 g
Polyunsaturated fat:
Poly. Fat
4.405 g
Contains
more
Mono. Fat Monounsaturated fat
+242.6%
Contains
less
Sat. Fat Saturated fat
-98%
Contains
more
Poly. Fat Polyunsaturated fat
+1158.6%