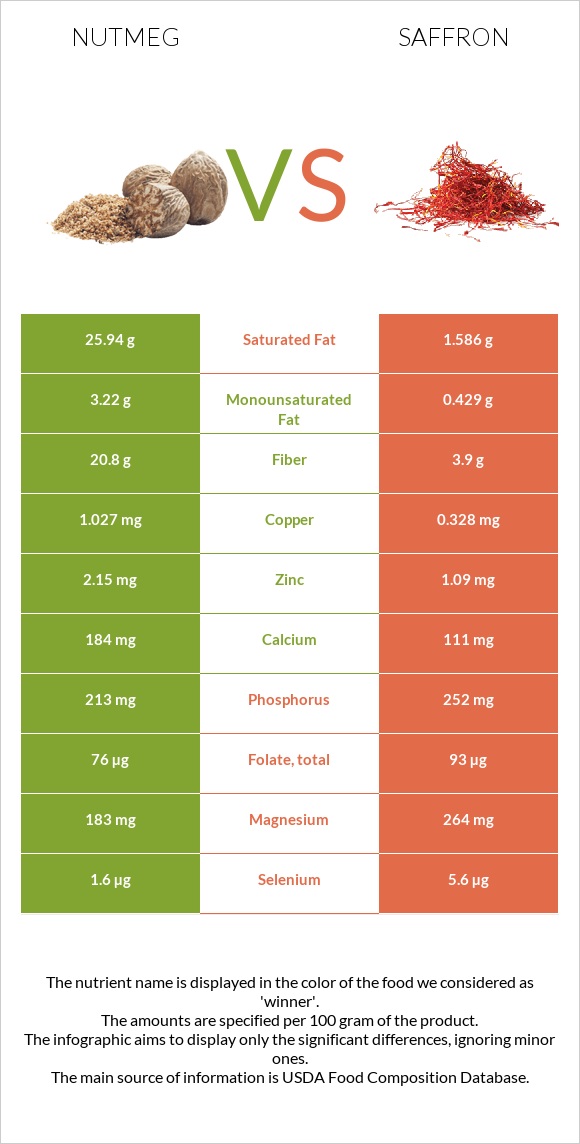
Important differences between nutmeg and saffron Nutmeg has more copper, fiber, and vitamin B1; however, saffron has more manganese, iron, vitamin C, vitamin B6, potassium, and magnesium. Saffron's daily need coverage for manganese is 1109% more. Nutmeg has 16 times more saturated fat than saffron. Nutmeg has 25.94g of saturated fat, while saffron has 1.586g. Saffron has a higher glycemic index than nutmeg. The food varieties used in the comparison are Spices, nutmeg, ground and Spices, saffron .
Infographic
Mineral Comparison
Mineral comparison score is based on the number of minerals by which one or the other food is richer. The "coverage" charts below show how much of the daily needs can be covered by 300 grams of the food.
4
100 g
300 g
0.25 tsp - 0.5g 1 tbsp - 7g
Magnesium
Magnesium
Calcium
Calcium
Potassium
Potassium
Iron
Iron
Copper
Copper
Zinc
Zinc
Phosphorus
Phosphorus
Sodium
Sodium
Manganese
Manganese
Selenium
Selenium
131%
55%
31%
114%
342%
59%
91%
2.1%
378%
8.7%
6
100 g
300 g
0.25 tsp - 0.5g 1 tbsp - 2.1g
Magnesium
Magnesium
Calcium
Calcium
Potassium
Potassium
Iron
Iron
Copper
Copper
Zinc
Zinc
Phosphorus
Phosphorus
Sodium
Sodium
Manganese
Manganese
Selenium
Selenium
189%
33%
152%
416%
109%
30%
108%
19%
3705%
31%
Vitamin Comparison
Vitamin comparison score is based on the number of vitamins by which one or the other food is richer. The "coverage" charts below show how much of the daily needs can be covered by 300 grams of the food.
1
100 g
300 g
0.25 tsp - 0.5g 1 tbsp - 7g
Vitamin C
Vit. C
Vitamin D
Vit. D
Vitamin A
Vit. A
Vitamin E
Vit. E
Vitamin B1
Vit. B1
Vitamin B2
Vit. B2
Vitamin B3
Vit. B3
Vitamin B5
Vit. B5
Vitamin B6
Vit. B6
Vitamin B12
Vit. B12
Vitamin K
Vit. K
Folate
Folate
10%
0%
1.7%
0%
87%
13%
24%
0%
37%
0%
0%
57%
6
100 g
300 g
0.25 tsp - 0.5g 1 tbsp - 2.1g
Vitamin C
Vit. C
Vitamin D
Vit. D
Vitamin A
Vit. A
Vitamin E
Vit. E
Vitamin B1
Vit. B1
Vitamin B2
Vit. B2
Vitamin B3
Vit. B3
Vitamin B5
Vit. B5
Vitamin B6
Vit. B6
Vitamin B12
Vit. B12
Vitamin K
Vit. K
Folate
Folate
269%
0%
9%
0%
29%
62%
27%
0%
233%
0%
0%
70%
All nutrients comparison - raw data values
Nutrient
DV% diff.
Manganese
2.9mg
28.408mg
1109%
Saturated fat
25.94g
1.586g
111%
Iron
3.04mg
11.1mg
101%
Vitamin C
3mg
80.8mg
86%
Copper
1.027mg
0.328mg
78%
Fiber
20.8g
3.9g
68%
Vitamin B6
0.16mg
1.01mg
65%
Fats
36.31g
5.85g
47%
Potassium
350mg
1724mg
40%
Magnesium
183mg
264mg
19%
Vitamin B1
0.346mg
0.115mg
19%
Vitamin B2
0.057mg
0.267mg
16%
Calories
525kcal
310kcal
11%
Protein
5.84g
11.43g
11%
Polyunsaturated fat
0.35g
2.067g
11%
Zinc
2.15mg
1.09mg
10%
Calcium
184mg
111mg
7%
Selenium
1.6µg
5.6µg
7%
Monounsaturated fat
3.22g
0.429g
7%
Phosphorus
213mg
252mg
6%
Sodium
16mg
148mg
6%
Carbs
49.29g
65.37g
5%
Folate
76µg
93µg
4%
Vitamin A
5µg
27µg
2%
Choline
8.8mg
2%
Vitamin B3
1.299mg
1.46mg
1%
Protein per 100 calories
1.1g
3.7g
N/A
Calories per 10 g protein
899kcal
271kcal
N/A
Weight per 100 calories
19g
32g
N/A
Unsaturated / Saturated Fat ratio
0.14
1.6
N/A
Net carbs
28.49g
61.47g
N/A
Sugar
2.99g
N/A
Omega-3 - DPA
0g
0.006g
N/A
Macronutrient Comparison
Macronutrient breakdown side-by-side comparison
1
6%
36%
49%
6%
2%
Protein:
5.84 g
Fats:
36.31 g
Carbs:
49.29 g
Water:
6.23 g
Other:
2.33 g
4
11%
6%
65%
12%
5%
Protein:
11.43 g
Fats:
5.85 g
Carbs:
65.37 g
Water:
11.9 g
Other:
5.45 g
Contains
more
Fats Fats
+520.7%
Contains
more
Protein Protein
+95.7%
Contains
more
Carbs Carbs
+32.6%
Contains
more
Water Water
+91%
Contains
more
Other Other
+133.9%
Fat Type Comparison
Fat type breakdown side-by-side comparison
1
88%
11%
Saturated fat:
Sat. Fat
25.94 g
Monounsaturated fat:
Mono. Fat
3.22 g
Polyunsaturated fat:
Poly. Fat
0.35 g
2
39%
11%
51%
Saturated fat:
Sat. Fat
1.586 g
Monounsaturated fat:
Mono. Fat
0.429 g
Polyunsaturated fat:
Poly. Fat
2.067 g
Contains
more
Mono. Fat Monounsaturated fat
+650.6%
Contains
less
Sat. Fat Saturated fat
-93.9%
Contains
more
Poly. Fat Polyunsaturated fat
+490.6%