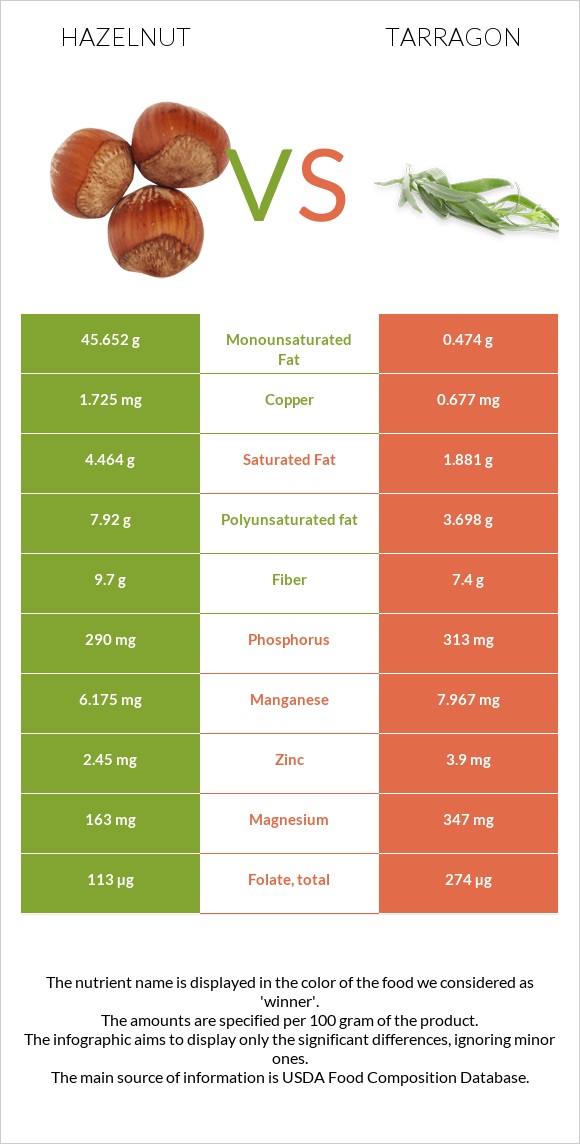
Differences between hazelnut and tarragon Hazelnut is higher in copper; however, tarragon is richer in iron, vitamin B6, calcium, vitamin B2, vitamin A, manganese, potassium, vitamin C, and vitamin B3. Tarragon's daily need coverage for iron is 345% higher. Hazelnut has 3 times more copper than tarragon. While hazelnut has 1.725mg of copper, tarragon has only 0.677mg. Tarragon has a lower glycemic index (0) than hazelnut (15). The food types used in this comparison are Nuts, hazelnuts or filberts and Spices, tarragon, dried .
Infographic
Mineral Comparison
Mineral comparison score is based on the number of minerals by which one or the other food is richer. The "coverage" charts below show how much of the daily needs can be covered by 300 grams of the food.
2
100 g
300 g
10 nuts - 14g 1 oz (21 whole kernels) - 28.35g 1 cup, ground - 75g 1 cup, chopped - 115g 1 cup, whole - 135g
Magnesium
Magnesium
Calcium
Calcium
Potassium
Potassium
Iron
Iron
Copper
Copper
Zinc
Zinc
Phosphorus
Phosphorus
Sodium
Sodium
Manganese
Manganese
Selenium
Selenium
116%
34%
60%
176%
575%
67%
124%
0%
805%
13%
7
100 g
300 g
0.25 tsp - 0.5g 1 tsp, ground - 1.6g 1 tbsp, leaves - 1.8g 1 tbsp, ground - 4.8g
Magnesium
Magnesium
Calcium
Calcium
Potassium
Potassium
Iron
Iron
Copper
Copper
Zinc
Zinc
Phosphorus
Phosphorus
Sodium
Sodium
Manganese
Manganese
Selenium
Selenium
248%
342%
266%
1211%
226%
106%
134%
8.1%
1039%
24%
Vitamin Comparison
Vitamin comparison score is based on the number of vitamins by which one or the other food is richer. The "coverage" charts below show how much of the daily needs can be covered by 300 grams of the food.
4
100 g
300 g
10 nuts - 14g 1 oz (21 whole kernels) - 28.35g 1 cup, ground - 75g 1 cup, chopped - 115g 1 cup, whole - 135g
Vitamin C
Vit. C
Vitamin D
Vit. D
Vitamin A
Vit. A
Vitamin E
Vit. E
Vitamin B1
Vit. B1
Vitamin B2
Vit. B2
Vitamin B3
Vit. B3
Vitamin B5
Vit. B5
Vitamin B6
Vit. B6
Vitamin B12
Vit. B12
Vitamin K
Vit. K
Folate
Folate
21%
0%
0.33%
301%
161%
26%
34%
55%
130%
0%
36%
85%
6
100 g
300 g
0.25 tsp - 0.5g 1 tsp, ground - 1.6g 1 tbsp, leaves - 1.8g 1 tbsp, ground - 4.8g
Vitamin C
Vit. C
Vitamin D
Vit. D
Vitamin A
Vit. A
Vitamin E
Vit. E
Vitamin B1
Vit. B1
Vitamin B2
Vit. B2
Vitamin B3
Vit. B3
Vitamin B5
Vit. B5
Vitamin B6
Vit. B6
Vitamin B12
Vit. B12
Vitamin K
Vit. K
Folate
Folate
167%
0%
70%
0%
63%
309%
168%
0%
556%
0%
0%
206%
All nutrients comparison - raw data values
Nutrient
DV% diff.
Iron
4.7mg
32.3mg
345%
Vitamin B6
0.563mg
2.41mg
142%
Copper
1.725mg
0.677mg
116%
Monounsaturated fat
45.652g
0.474g
113%
Calcium
114mg
1139mg
103%
Vitamin E
15.03mg
100%
Vitamin B2
0.113mg
1.339mg
94%
Fats
60.75g
7.24g
82%
Manganese
6.175mg
7.967mg
78%
Potassium
680mg
3020mg
69%
Vitamin C
6.3mg
50mg
49%
Vitamin B3
1.8mg
8.95mg
45%
Magnesium
163mg
347mg
44%
Folate
113µg
274µg
40%
Vitamin B1
0.643mg
0.251mg
33%
Polyunsaturated fat
7.92g
3.698g
28%
Vitamin A
1µg
210µg
23%
Vitamin B5
0.918mg
18%
Calories
628kcal
295kcal
17%
Protein
14.95g
22.77g
16%
Zinc
2.45mg
3.9mg
13%
Vitamin K
14.2µg
12%
Saturated fat
4.464g
1.881g
12%
Carbs
16.7g
50.22g
11%
Fiber
9.7g
7.4g
9%
Choline
45.6mg
8%
Selenium
2.4µg
4.4µg
4%
Phosphorus
290mg
313mg
3%
Sodium
0mg
62mg
3%
Protein per 100 calories
2.4g
7.7g
N/A
Calories per 10 g protein
420kcal
130kcal
N/A
Weight per 100 calories
16g
34g
N/A
Unsaturated / Saturated Fat ratio
12
2.2
N/A
Net carbs
7g
42.82g
N/A
Sugar
4.34g
N/A
Starch
0.48g
0%
Tryptophan
0.193mg
0%
Threonine
0.497mg
0%
Isoleucine
0.545mg
0%
Leucine
1.063mg
0%
Lysine
0.42mg
0%
Methionine
0.221mg
0%
Phenylalanine
0.663mg
0%
Valine
0.701mg
0%
Histidine
0.432mg
0%
Fructose
0.07g
0%
Macronutrient Comparison
Macronutrient breakdown side-by-side comparison
1
15%
61%
17%
5%
2%
Protein:
14.95 g
Fats:
60.75 g
Carbs:
16.7 g
Water:
5.31 g
Other:
2.29 g
4
23%
7%
50%
8%
12%
Protein:
22.77 g
Fats:
7.24 g
Carbs:
50.22 g
Water:
7.74 g
Other:
12.03 g
Contains
more
Fats Fats
+739.1%
Contains
more
Protein Protein
+52.3%
Contains
more
Carbs Carbs
+200.7%
Contains
more
Water Water
+45.8%
Contains
more
Other Other
+425.3%
Fat Type Comparison
Fat type breakdown side-by-side comparison
2
8%
79%
14%
Saturated fat:
Sat. Fat
4.464 g
Monounsaturated fat:
Mono. Fat
45.652 g
Polyunsaturated fat:
Poly. Fat
7.92 g
1
31%
8%
61%
Saturated fat:
Sat. Fat
1.881 g
Monounsaturated fat:
Mono. Fat
0.474 g
Polyunsaturated fat:
Poly. Fat
3.698 g
Contains
more
Mono. Fat Monounsaturated fat
+9531.2%
Contains
more
Poly. Fat Polyunsaturated fat
+114.2%
Contains
less
Sat. Fat Saturated fat
-57.9%