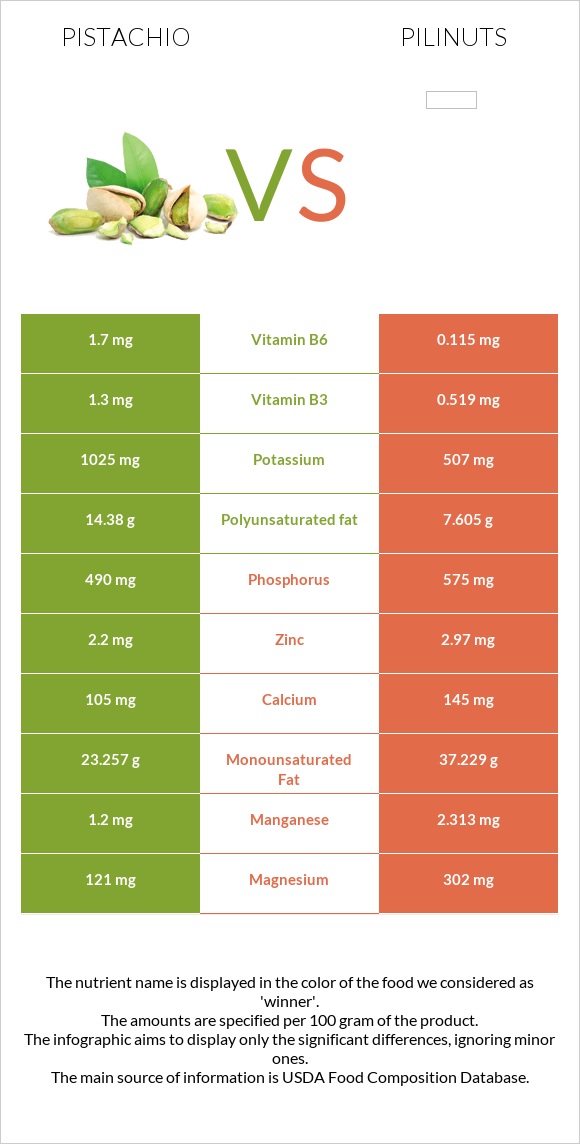
What are the main differences between pistachios and pili nuts? Pistachios are richer in vitamin B6, copper, potassium, vitamin A, and vitamin C, yet pili nuts are richer in manganese, magnesium, phosphorus, and zinc. Pili nuts' daily need coverage for saturated fat is 126% higher. Pistachios have 15 times more vitamin B6 than pili nuts. Pistachios have 1.7mg of vitamin B6, while pili nuts have 0.115mg. Pistachios contain less saturated fat. We used Nuts, pistachio nuts, raw and Nuts, pilinuts, dried types in this comparison.
Infographic
Mineral Comparison
Mineral comparison score is based on the number of minerals by which one or the other food is richer. The "coverage" charts below show how much of the daily needs can be covered by 300 grams of the food.
4
100 g
300 g
1 kernel - 0.7g 1 oz (49 kernels) - 28.35g 1 cup - 123g
Magnesium
Magnesium
Calcium
Calcium
Potassium
Potassium
Iron
Iron
Copper
Copper
Zinc
Zinc
Phosphorus
Phosphorus
Sodium
Sodium
Manganese
Manganese
Selenium
Selenium
86%
32%
90%
147%
433%
60%
210%
0.13%
157%
38%
5
100 g
300 g
1 oz (15 kernels) - 28.35g 1 cup - 120g
Magnesium
Magnesium
Calcium
Calcium
Potassium
Potassium
Iron
Iron
Copper
Copper
Zinc
Zinc
Phosphorus
Phosphorus
Sodium
Sodium
Manganese
Manganese
Selenium
Selenium
216%
44%
45%
132%
319%
81%
246%
0.39%
302%
0%
Vitamin Comparison
Vitamin comparison score is based on the number of vitamins by which one or the other food is richer. The "coverage" charts below show how much of the daily needs can be covered by 300 grams of the food.
6
100 g
300 g
1 kernel - 0.7g 1 oz (49 kernels) - 28.35g 1 cup - 123g
Vitamin C
Vit. C
Vitamin D
Vit. D
Vitamin A
Vit. A
Vitamin E
Vit. E
Vitamin B1
Vit. B1
Vitamin B2
Vit. B2
Vitamin B3
Vit. B3
Vitamin B5
Vit. B5
Vitamin B6
Vit. B6
Vitamin B12
Vit. B12
Vitamin K
Vit. K
Folate
Folate
19%
0%
8.7%
57%
218%
37%
24%
31%
392%
0%
0%
38%
1
100 g
300 g
1 oz (15 kernels) - 28.35g 1 cup - 120g
Vitamin C
Vit. C
Vitamin D
Vit. D
Vitamin A
Vit. A
Vitamin E
Vit. E
Vitamin B1
Vit. B1
Vitamin B2
Vit. B2
Vitamin B3
Vit. B3
Vitamin B5
Vit. B5
Vitamin B6
Vit. B6
Vitamin B12
Vit. B12
Vitamin K
Vit. K
Folate
Folate
2%
0%
0.67%
0%
228%
21%
9.7%
29%
27%
0%
0%
45%
All nutrients comparison - raw data values
Nutrient
DV% diff.
Vitamin B6
1.7mg
0.115mg
122%
Saturated fat
5.907g
31.184g
115%
Fats
45.32g
79.55g
53%
Manganese
1.2mg
2.313mg
48%
Polyunsaturated fat
14.38g
7.605g
45%
Magnesium
121mg
302mg
43%
Fiber
10.6g
42%
Copper
1.3mg
0.958mg
38%
Monounsaturated fat
23.257g
37.229g
35%
Protein
20.16g
10.8g
19%
Vitamin E
2.86mg
19%
Potassium
1025mg
507mg
15%
Selenium
7µg
13%
Phosphorus
490mg
575mg
12%
Calories
560kcal
719kcal
8%
Carbs
27.17g
3.98g
8%
Zinc
2.2mg
2.97mg
7%
Vitamin C
5.6mg
0.6mg
6%
Iron
3.92mg
3.53mg
5%
Vitamin B2
0.16mg
0.093mg
5%
Vitamin B3
1.3mg
0.519mg
5%
Calcium
105mg
145mg
4%
Vitamin B1
0.87mg
0.913mg
4%
Vitamin A
26µg
2µg
3%
Folate
51µg
60µg
2%
Starch
1.67g
1%
Vitamin B5
0.52mg
0.479mg
1%
Protein per 100 calories
3.6g
1.5g
N/A
Calories per 10 g protein
278kcal
666kcal
N/A
Weight per 100 calories
18g
14g
N/A
Unsaturated / Saturated Fat ratio
6.4
1.4
N/A
Net carbs
16.57g
3.98g
N/A
Sugar
7.66g
N/A
Sodium
1mg
3mg
0%
Tryptophan
0.251mg
0.189mg
0%
Threonine
0.684mg
0.407mg
0%
Isoleucine
0.917mg
0.483mg
0%
Leucine
1.604mg
0.89mg
0%
Lysine
1.138mg
0.369mg
0%
Methionine
0.36mg
0.395mg
0%
Phenylalanine
1.092mg
0.497mg
0%
Valine
1.249mg
0.701mg
0%
Histidine
0.512mg
0.255mg
0%
Fructose
0.24g
0%
Omega-6 - Linoleic acid
14.091g
N/A
Macronutrient Comparison
Macronutrient breakdown side-by-side comparison
4
20%
45%
27%
4%
3%
Protein:
20.16 g
Fats:
45.32 g
Carbs:
27.17 g
Water:
4.37 g
Other:
2.98 g
1
11%
80%
4%
3%
3%
Protein:
10.8 g
Fats:
79.55 g
Carbs:
3.98 g
Water:
2.77 g
Other:
2.9 g
Contains
more
Protein Protein
+86.7%
Contains
more
Carbs Carbs
+582.7%
Contains
more
Water Water
+57.8%
Contains
more
Fats Fats
+75.5%
Fat Type Comparison
Fat type breakdown side-by-side comparison
2
14%
53%
33%
Saturated fat:
Sat. Fat
5.907 g
Monounsaturated fat:
Mono. Fat
23.257 g
Polyunsaturated fat:
Poly. Fat
14.38 g
1
41%
49%
10%
Saturated fat:
Sat. Fat
31.184 g
Monounsaturated fat:
Mono. Fat
37.229 g
Polyunsaturated fat:
Poly. Fat
7.605 g
Contains
less
Sat. Fat Saturated fat
-81.1%
Contains
more
Poly. Fat Polyunsaturated fat
+89.1%
Contains
more
Mono. Fat Monounsaturated fat
+60.1%