
Oatmeal vs. Grape-Nuts Cereal — Health Impact and Nutrition Comparison


Summary
Grape-Nut Cereal offers higher quantities of Iron, Manganese, folate, Phosphorus, Fiber, Vitamin B6, Vitamin B3, Vitamin B1, Copper, and Magnesium. Notably, grape-nut cereal provides 276% more Iron per day's requirement. Oatmeal has 44 g of folate, but grape-nut cereal has 8 times as much, or 345 g, in comparison.
Introduction
Grape-Nuts cereal, crafted in 1897 by C.W. Post, is a timeless breakfast delight. Despite its name, it neither includes grapes nor nuts. The moniker derives from its nutty flavor and grape seed-like appearance. Whole wheat and malted barley flours are baked to form the crunchy texture of grape nuts. This cereal adds character to baked goods, yogurt, and salads.
With roots in the Near East, oats found their way to Europe and the Middle East. Processed mainly into oatmeal and rolled oats, they thrive in temperate climates, notably in Russia and Canada. Oats offer diverse foods—oatmeal, flour, milk, and more. They also serve in livestock feeding and alcoholic beverage production, including whiskey.
Nutrition
The nutritional values are presented for 100g of grape-nut cereal and oatmeal, both prepared with water.
Macronutrients and Calories
Grape-nut cereal has higher net carbs (67.49g vs. 9.97g), protein (11.22g vs. 2.37g), fats (1.81g vs. 1.36g), total carbs (80.49g vs. 11.67g), and calories (361 kcal vs. 68 kcal) compared to oatmeal. Regarding specific carbohydrates, oatmeal contains more starch (10.37g), while grape-nut cereal has a higher sugar content (8.86g vs. 0.46g). Additionally, grape-nut cereal boasts a higher fiber content (13g vs. 1.7g) than Oatmeal.
Macronutrient Comparison
Contains
more
WaterWater
+2300.9%
Contains
more
ProteinProtein
+373.4%
Contains
more
FatsFats
+33.1%
Contains
more
CarbsCarbs
+589.7%
Contains
more
OtherOther
+422.8%
Calories
Grape-Nut Cereal contains notably higher calories at 361 kcal, while oatmeal provides 68 kcal.
Protein
Grape-Nut Cereal offers significantly more protein at 11.22g, whereas oatmeal provides 2.37 g.
Fats
Oatmeal contains less saturated fat and monounsaturated fat than grape-nut cereal. However, grape-nut cereal has a higher polyunsaturated fat content compared to oatmeal.
Fat Type Comparison
Contains
less
Sat. FatSaturated fat
-33.5%
Contains
more
Mono. FatMonounsaturated fat
+86.2%
Contains
more
Poly. FatPolyunsaturated fat
+83.1%
Vitamins
Compared to oatmeal, grape-nut cereal contains higher levels of vitamin E, vitamin C, vitamin B1, vitamin B3, vitamin B5, and vitamin folic acid. But oatmeal is the top source of vitamin A, vitamin B2, and vitamin K.
Vitamin Comparison
Contains
more
Vitamin AVitamin A
+∞%
Contains
more
Vitamin B2Vitamin B2
+79.2%
Contains
more
Vitamin CVitamin C
+∞%
Contains
more
Vitamin EVitamin E
+785.7%
Contains
more
Vitamin B1Vitamin B1
+150%
Contains
more
Vitamin B3Vitamin B3
+185%
Contains
more
Vitamin B5Vitamin B5
+175.1%
Contains
more
Vitamin B6Vitamin B6
+196.6%
Contains
more
Vitamin KVitamin K
+400%
Contains
more
FolateFolate
+684.1%
Minerals
Grape-Nut Cereal has five times more iron, manganese, magnesium, and copper, six times more phosphorus and potassium, three times more zinc, and two times more selenium than oatmeal.
In contrast, oatmeal has nine times more sodium and three times more calcium.
Mineral Comparison
Contains
more
CalciumCalcium
+150%
Contains
less
SodiumSodium
-89.5%
Contains
more
MagnesiumMagnesium
+376.9%
Contains
more
PotassiumPotassium
+555.7%
Contains
more
IronIron
+369.8%
Contains
more
CopperCopper
+415.2%
Contains
more
ZincZinc
+233.9%
Contains
more
PhosphorusPhosphorus
+506.5%
Contains
more
ManganeseManganese
+479.9%
Contains
more
SeleniumSelenium
+82%
Glycemic Index
Both grape-nut cereal and oatmeal have relatively high glycemic indices. This suggests that both foods can cause a rapid increase in blood sugar levels after consumption. The glycemic index value of grape-nut cereal is 75, and the glycemic index value of oatmeal is 79.
Go to our Glycemic Index Chart: Complete (350+) List from the All Sources page to learn about the glycemic index values of various foods.
Glycemic Load
Grape-Nut Cereal has a slightly higher glycemic load of 18 (medium) than oatmeal, which has a glycemic load of 16.
Acidity
Grape-Nut Cereal has a higher acidity based on PRAL, with a value of 10.7, while oatmeal has a PRAL value equal to 1. This suggests that grape-nut cereal may have a more pronounced acid-forming effect on the body than oatmeal.
Weight Loss and Diets
Grape-Nut Cereal and oatmeal can be incorporated into various popular diets to meet specific nutritional needs:
Oatmeal and grape nut cereal are high in carbs and cannot be consumed on the keto diet. Oatmeal can be part of a DASH diet, as it is low in sodium and can contribute to a balanced and heart-healthy eating plan.
Both options can be included in Vegan diets, with oatmeal being exceptionally versatile and nutritious. Oat milk is also available as an alternative to dairy milk. Oatmeal, known for its gentle and easily digestible nature, is suitable for the BRAT (Bananas, Rice, apple sauce, and toast) diet during digestive upset. Grape nuts may be too abrasive during such times.
Baby food
Grape-Nut cereal and oatmeal can be included in a baby's diet, but time and cooking techniques are critical concerns.
Oatmeal is recommended for babies since it contains fiber, minerals, and vitamins. It is incredibly adaptable and may be turned into a stew or constantly combined with other nutritional meals, such as fruits.
In addition, oats are advised for newborns as soon as they can eat solid meals.
While Grape-Nuts cereal contains whole wheat and malted barley, which are typically healthy for older children, its gritty texture makes it inappropriate for extremely young newborns who are just starting on solid meals. It is critical to wait until your infant has established the capacity to chew and swallow more solid textures before beginning.
Health Impact
Cardiovascular Health

According to this study, oat consumption may reduce systolic blood pressure. As for grape-nut cereal, no research has been done to support its potential to lower arterial blood pressure (1.2).
Studies have shown a correlation between consuming oatmeal and reduced LDL (bad cholesterol) levels in the blood. It should be noted that there's no evidence that grape-nut cereal has a hypolipidemic effect. However, grape nut cereal has significant levels of niacin, which can be utilized to treat hyperlipidemia. On the other hand, grape polyphenols are known to regulate the lipid profile and lower LDL levels (3.4).
In conclusion, both of these are good for reducing the risk of cardiovascular disease.
Diabetes
Blood glucose and cholesterol levels were shown to be lower in people with uncontrolled type 2 diabetes. Oats have been associated with hypercholesterolemia and hyperglycemia control (5). Consuming whole-grain cereals like oats and grape nut cereal lowers the risk of acquiring type 2 diabetes. It also affects blood glucose and cholesterol levels. When compared to other cereal grains, oat-based diets had lower fatty acid absorption (6).
Digestive Health
Grape-Nuts cereal and oatmeal, rich in dietary fiber due to their whole grain composition, offer digestive health benefits. They aid in maintaining regular bowel movements, preventing constipation, and promoting a healthy digestive system. Furthermore, their fiber content supports the growth of beneficial gut bacteria, enhancing overall digestive well-being (7). It's worth noting that oats have also been associated with improved intestinal microbiota and similar protective properties to wheat regarding reducing the risk of diverticulosis (8.9.10).
Gluten intolerance
One of the most noticeable differences between oat and grape nut cereals is the absence of gluten. Grape nut cereal is manufactured from wheat and barley. These gluten-containing grains should not be consumed if you follow a gluten-free diet. On the other hand, because oats do not contain gluten, they provide a gluten-free alternative to barley. Because oat flour does not contain gluten, it is a perfect alternative to any gluten-containing flour. However, the gluten-free feature influences the breadmaking process, for example, because gluten is one of the elements that hold the bread together and prevent it from crumbling and drying out.
Lactose intolerance
Grape-Nuts cereal and oatmeal are suitable options for individuals with lactose intolerance, as they typically do not contain lactose. Lactose-intolerant patients can substitute oat milk for dairy milk.
Cancer
Oats include beta-glucans, which have anti-cancer effects against lung cancer cells (11).
Grape-Nuts cereal has an essential and healthful ingredient list, including whole wheat flour, malted barley flour, salt, and yeast. These common substances are not usually linked to an increased risk of cancer. It is worth noting that the type of wheat can considerably impact its effect on cancer risk. Whole-grain brown wheat, in particular, has been shown to protect against the development of colon cancer (12).
On the other hand, highly processed foods should be avoided since they have been linked to an increased risk of cancer, particularly breast cancer. These ultra-processed meals may raise risk by promoting fat or harboring potential toxins (13).
Sources
- https://pubmed.ncbi.nlm.nih.gov/36435335/
- https://pubmed.ncbi.nlm.nih.gov/36432463/
- https://jamanetwork.com/journals/jama/article-abstract/385568
- https://www.ncbi.nlm.nih.gov/pmc/articles/PMC7073656/
- https://pubmed.ncbi.nlm.nih.gov/26690472/
- https://pubmed.ncbi.nlm.nih.gov/32641435/
- https://www.ncbi.nlm.nih.gov/pmc/articles/PMC4616929/
- https://pubmed.ncbi.nlm.nih.gov/31638148/
- https://pubmed.ncbi.nlm.nih.gov/26267774/
- https://pubmed.ncbi.nlm.nih.gov/15471177/
- https://pubmed.ncbi.nlm.nih.gov/28756506/
- https://pubmed.ncbi.nlm.nih.gov/24820704/
- https://www.nature.com/articles/s41416-022-01749-y

Infographic
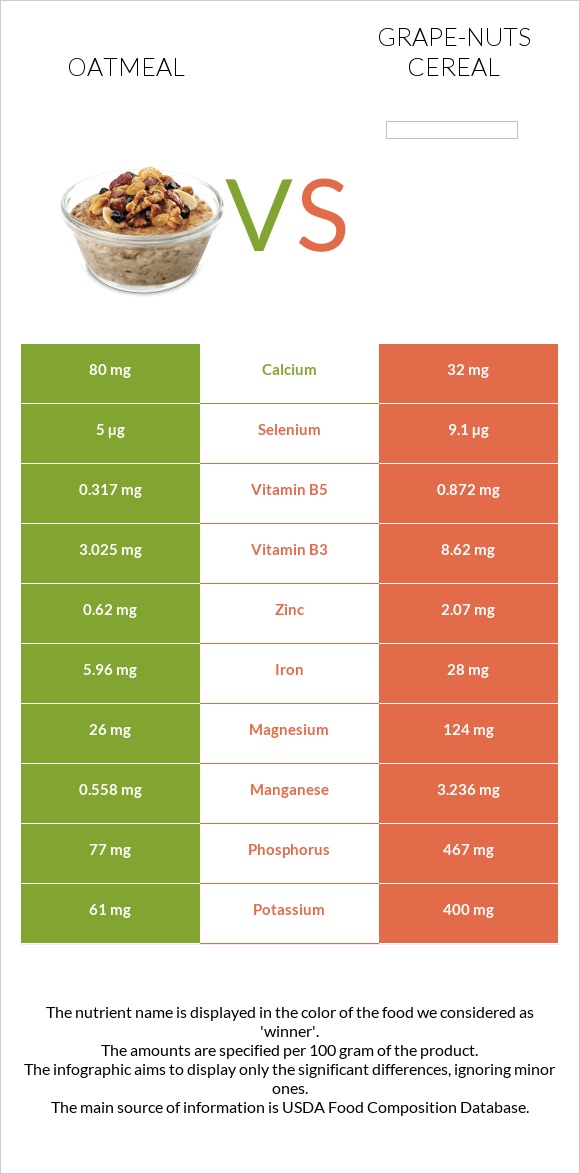
All nutrients comparison - raw data values
| Nutrient | |
|
DV% diff. |
| Iron | 5.96mg | 28mg | 276% |
| Manganese | 0.558mg | 3.236mg | 116% |
| Folate | 44µg | 345µg | 75% |
| Phosphorus | 77mg | 467mg | 56% |
| Fiber | 1.7g | 13g | 45% |
| Vitamin B6 | 0.29mg | 0.86mg | 44% |
| Vitamin B3 | 3.025mg | 8.62mg | 35% |
| Vitamin B1 | 0.26mg | 0.65mg | 33% |
| Copper | 0.066mg | 0.34mg | 30% |
| Carbs | 11.67g | 80.49g | 23% |
| Magnesium | 26mg | 124mg | 23% |
| Protein | 2.37g | 11.22g | 18% |
| Sodium | 49mg | 465mg | 18% |
| Calories | 68kcal | 361kcal | 15% |
| Vitamin A | 130µg | 0µg | 14% |
| Zinc | 0.62mg | 2.07mg | 13% |
| Vitamin B5 | 0.317mg | 0.872mg | 11% |
| Potassium | 61mg | 400mg | 10% |
| Selenium | 5µg | 9.1µg | 7% |
| Vitamin B2 | 0.215mg | 0.12mg | 7% |
| Calcium | 80mg | 32mg | 5% |
| Choline | 4.7mg | 31.9mg | 5% |
| Starch | 10.37g | 4% | |
| Vitamin E | 0.07mg | 0.62mg | 4% |
| Polyunsaturated fat | 0.426g | 0.78g | 2% |
| Fats | 1.36g | 1.81g | 1% |
| Vitamin K | 0.4µg | 2µg | 1% |
| Saturated fat | 0.226g | 0.34g | 1% |
| Protein per 100 calories | 3.5g | 3.1g | N/A |
| Calories per 10 g protein | 287kcal | 322kcal | N/A |
| Weight per 100 calories | 147g | 28g | N/A |
| Vitamin C | 0mg | 0.1mg | 0% |
| Net carbs | 9.97g | 67.49g | N/A |
| Sugar | 0.46g | 8.86g | N/A |
| Trans fat | 0.003g | 0g | N/A |
| Monounsaturated fat | 0.391g | 0.21g | 0% |
| Tryptophan | 0.04mg | 0% | |
| Threonine | 0.083mg | 0% | |
| Isoleucine | 0.105mg | 0% | |
| Leucine | 0.2mg | 0% | |
| Lysine | 0.135mg | 0% | |
| Methionine | 0.04mg | 0% | |
| Phenylalanine | 0.13mg | 0% | |
| Valine | 0.151mg | 0% | |
| Histidine | 0.057mg | 0% |
People also compare


References
All the values for which the sources are not specified explicitly are taken from FDA’s Food Central. The exact link to the food presented on this page can be found below.
- Oatmeal - https://fdc.nal.usda.gov/fdc-app.html#/food-details/171662/nutrients
- Grape-Nuts Cereal - https://fdc.nal.usda.gov/fdc-app.html#/food-details/171647/nutrients
All the Daily Values are presented for males aged 31-50, for 2000-calorie diets.