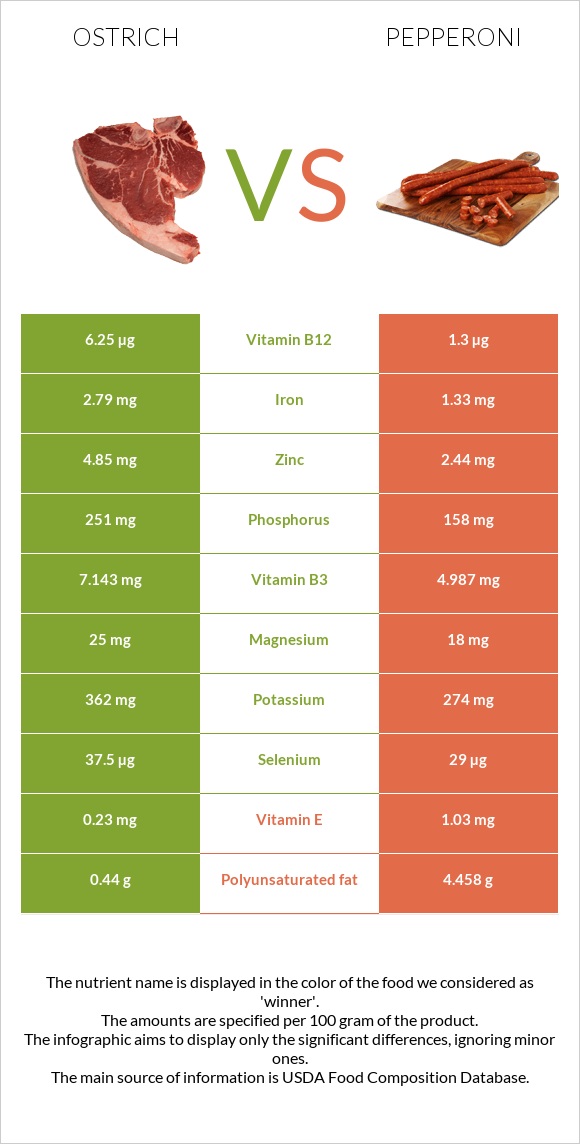
Summary of differences between ostrich and pepperoni Ostrich has more vitamin B12, zinc, iron, selenium, vitamin B6, vitamin B3, and phosphorus; however, pepperoni is higher in manganese. Ostrich covers your daily need for vitamin B12, 206% more than pepperoni. Ostrich has 2 times more iron than pepperoni. While ostrich has 2.79mg of iron, pepperoni has only 1.33mg. Ostrich has less saturated fat. The glycemic index of pepperoni is higher. These are the specific foods used in this comparison Ostrich, tip trimmed, cooked and Pepperoni, beef, and pork, sliced .
Infographic
Mineral Comparison
Mineral comparison score is based on the number of minerals by which one or the other food is richer. The "coverage" charts below show how much of the daily needs can be covered by 300 grams of the food.
8
100 g
300 g
1 serving ( 3 oz ) - 85g
Magnesium
Magnesium
Calcium
Calcium
Potassium
Potassium
Iron
Iron
Copper
Copper
Zinc
Zinc
Phosphorus
Phosphorus
Sodium
Sodium
Manganese
Manganese
Selenium
Selenium
18%
1.8%
32%
105%
51%
132%
108%
10%
2.5%
205%
2
100 g
300 g
1 piece - 2g 1 oz - 28g 3 oz - 85g
Magnesium
Magnesium
Calcium
Calcium
Potassium
Potassium
Iron
Iron
Copper
Copper
Zinc
Zinc
Phosphorus
Phosphorus
Sodium
Sodium
Manganese
Manganese
Selenium
Selenium
13%
5.7%
24%
50%
30%
67%
68%
206%
140%
158%
Vitamin Comparison
Vitamin comparison score is based on the number of vitamins by which one or the other food is richer. The "coverage" charts below show how much of the daily needs can be covered by 300 grams of the food.
6
100 g
300 g
1 serving ( 3 oz ) - 85g
Vitamin C
Vit. C
Vitamin D
Vit. D
Vitamin A
Vit. A
Vitamin E
Vit. E
Vitamin B1
Vit. B1
Vitamin B2
Vit. B2
Vitamin B3
Vit. B3
Vitamin B5
Vit. B5
Vitamin B6
Vit. B6
Vitamin B12
Vit. B12
Vitamin K
Vit. K
Folate
Folate
0%
0%
0%
4.6%
58%
67%
134%
79%
126%
781%
0%
11%
4
100 g
300 g
1 piece - 2g 1 oz - 28g 3 oz - 85g
Vitamin C
Vit. C
Vitamin D
Vit. D
Vitamin A
Vit. A
Vitamin E
Vit. E
Vitamin B1
Vit. B1
Vitamin B2
Vit. B2
Vitamin B3
Vit. B3
Vitamin B5
Vit. B5
Vitamin B6
Vit. B6
Vitamin B12
Vit. B12
Vitamin K
Vit. K
Folate
Folate
0%
20%
0%
21%
68%
59%
94%
56%
84%
163%
15%
3.8%
All nutrients comparison - raw data values
Nutrient
DV% diff.
Vitamin B12
6.25µg
1.3µg
206%
Saturated fat
1g
17.708g
76%
Fats
2.57g
46.28g
67%
Sodium
80mg
1582mg
65%
Monounsaturated fat
0.97g
20.77g
50%
Manganese
0.019mg
1.074mg
46%
Polyunsaturated fat
0.44g
4.458g
27%
Zinc
4.85mg
2.44mg
22%
Calories
145kcal
504kcal
18%
Protein
28.49g
19.25g
18%
Iron
2.79mg
1.33mg
18%
Selenium
37.5µg
29µg
15%
Vitamin B6
0.545mg
0.362mg
14%
Phosphorus
251mg
158mg
13%
Vitamin B3
7.143mg
4.987mg
13%
Choline
51.2mg
9%
Vitamin B5
1.318mg
0.93mg
8%
Vitamin D*
52 IU
7%
Vitamin D
1.3µg
7%
Copper
0.152mg
0.091mg
7%
Vitamin E
0.23mg
1.03mg
5%
Vitamin K
5.8µg
5%
Cholesterol
85mg
97mg
4%
Potassium
362mg
274mg
3%
Vitamin B1
0.232mg
0.271mg
3%
Vitamin B2
0.292mg
0.257mg
3%
Folate
15µg
5µg
3%
Magnesium
25mg
18mg
2%
Calcium
6mg
19mg
1%
Protein per 100 calories
20g
3.8g
N/A
Calories per 10 g protein
51kcal
262kcal
N/A
Weight per 100 calories
69g
20g
N/A
Unsaturated / Saturated Fat ratio
1.4
1.4
N/A
Net carbs
0g
1.18g
N/A
Carbs
0g
1.18g
0%
Trans fat
1.527g
N/A
Tryptophan
0.254mg
0.23mg
0%
Threonine
1.25mg
0.869mg
0%
Isoleucine
1.354mg
0.901mg
0%
Leucine
2.315mg
1.575mg
0%
Lysine
2.516mg
1.652mg
0%
Methionine
0.796mg
0.511mg
0%
Phenylalanine
1.176mg
0.778mg
0%
Valine
1.407mg
0.987mg
0%
Histidine
0.716mg
0.688mg
0%
Omega-3 - EPA
0.004g
N/A
Omega-3 - DHA
0.004g
N/A
Omega-3 - ALA
0.164g
N/A
Omega-3 - DPA
0.02g
N/A
Omega-3 - Eicosatrienoic acid
0.018g
N/A
Omega-6 - Gamma-linoleic acid
0.002g
N/A
Omega-6 - Dihomo-gamma-linoleic acid
0.04g
N/A
Omega-6 - Eicosadienoic acid
0.136g
N/A
Omega-6 - Linoleic acid
3.605g
N/A
Macronutrient Comparison
Macronutrient breakdown side-by-side comparison
2
28%
3%
69%
Protein:
28.49 g
Fats:
2.57 g
Carbs:
0 g
Water:
68.51 g
Other:
0.43 g
3
19%
46%
29%
5%
Protein:
19.25 g
Fats:
46.28 g
Carbs:
1.18 g
Water:
28.55 g
Other:
4.74 g
Contains
more
Protein Protein
+48%
Contains
more
Water Water
+140%
Contains
more
Fats Fats
+1700.8%
Contains
more
Carbs Carbs
+∞%
Contains
more
Other Other
+1002.3%
Fat Type Comparison
Fat type breakdown side-by-side comparison
1
41%
40%
18%
Saturated fat:
Sat. Fat
1 g
Monounsaturated fat:
Mono. Fat
0.97 g
Polyunsaturated fat:
Poly. Fat
0.44 g
2
41%
48%
10%
Saturated fat:
Sat. Fat
17.708 g
Monounsaturated fat:
Mono. Fat
20.77 g
Polyunsaturated fat:
Poly. Fat
4.458 g
Contains
less
Sat. Fat Saturated fat
-94.4%
Contains
more
Mono. Fat Monounsaturated fat
+2041.2%
Contains
more
Poly. Fat Polyunsaturated fat
+913.2%