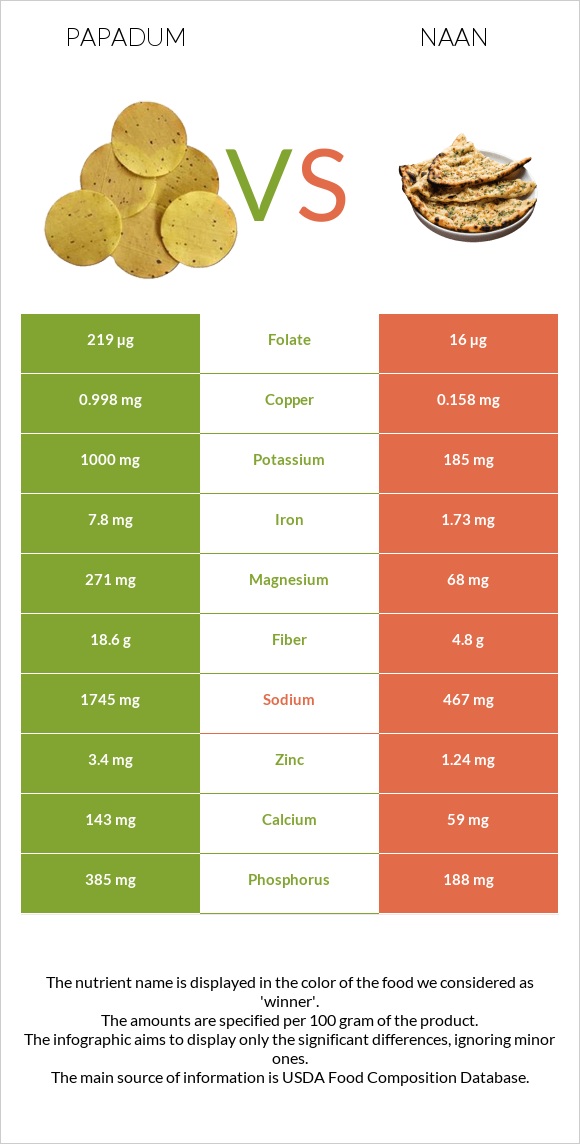
What are the differences between papadum and naan? Papadum is higher in copper, iron, fiber, folate, magnesium, phosphorus, potassium, and zinc, yet naan is higher in vitamin B3. Papadum's daily need coverage for copper is 93% more. Papadum has 14 times more folate than naan. While papadum has 219µg of folate, naan has only 16µg. The amount of sodium in naan is lower. The glycemic index of papadum is lower. We used Papad and Bread, naan, whole wheat, commercially prepared, refrigerated types in this article.
Infographic
Mineral Comparison
Mineral comparison score is based on the number of minerals by which one or the other food is richer. The "coverage" charts below show how much of the daily needs can be covered by 300 grams of the food.
8
100 g
300 g
Magnesium
Magnesium
Calcium
Calcium
Potassium
Potassium
Iron
Iron
Copper
Copper
Zinc
Zinc
Phosphorus
Phosphorus
Sodium
Sodium
Manganese
Manganese
Selenium
Selenium
194%
43%
88%
293%
333%
93%
165%
228%
204%
45%
2
100 g
300 g
1 piece - 106g
Magnesium
Magnesium
Calcium
Calcium
Potassium
Potassium
Iron
Iron
Copper
Copper
Zinc
Zinc
Phosphorus
Phosphorus
Sodium
Sodium
Manganese
Manganese
Selenium
Selenium
49%
18%
16%
65%
53%
34%
81%
61%
183%
62%
Vitamin Comparison
Vitamin comparison score is based on the number of vitamins by which one or the other food is richer. The "coverage" charts below show how much of the daily needs can be covered by 300 grams of the food.
6
100 g
300 g
Vitamin C
Vit. C
Vitamin D
Vit. D
Vitamin A
Vit. A
Vitamin E
Vit. E
Vitamin B1
Vit. B1
Vitamin B2
Vit. B2
Vitamin B3
Vit. B3
Vitamin B5
Vit. B5
Vitamin B6
Vit. B6
Vitamin B12
Vit. B12
Vitamin K
Vit. K
Folate
Folate
0%
0%
4.3%
1%
69%
60%
28%
55%
66%
0%
1%
164%
3
100 g
300 g
1 piece - 106g
Vitamin C
Vit. C
Vitamin D
Vit. D
Vitamin A
Vit. A
Vitamin E
Vit. E
Vitamin B1
Vit. B1
Vitamin B2
Vit. B2
Vitamin B3
Vit. B3
Vitamin B5
Vit. B5
Vitamin B6
Vit. B6
Vitamin B12
Vit. B12
Vitamin K
Vit. K
Folate
Folate
0%
0%
0.67%
26%
44%
42%
67%
0%
30%
0%
8.3%
12%
All nutrients comparison - raw data values
Nutrient
DV% diff.
Copper
0.998mg
0.158mg
93%
Iron
7.8mg
1.73mg
76%
Sodium
1745mg
467mg
56%
Fiber
18.6g
4.8g
55%
Folate
219µg
16µg
51%
Magnesium
271mg
68mg
48%
Protein
25.56g
10.2g
31%
Phosphorus
385mg
188mg
28%
Potassium
1000mg
185mg
24%
Zinc
3.4mg
1.24mg
20%
Vitamin B5
0.917mg
18%
Starch
36g
15%
Vitamin B3
1.472mg
3.58mg
13%
Vitamin B6
0.285mg
0.128mg
12%
Calcium
143mg
59mg
8%
Vitamin E
0.05mg
1.32mg
8%
Vitamin B1
0.277mg
0.176mg
8%
Saturated fat
1.084g
2.907g
8%
Manganese
1.562mg
1.4mg
7%
Selenium
8.3µg
11.4µg
6%
Vitamin B2
0.258mg
0.18mg
6%
Fats
3.25g
6.7g
5%
Carbs
59.87g
46.21g
5%
Calories
371kcal
286kcal
4%
Monounsaturated fat
0.532g
1.946g
4%
Vitamin K
0.4µg
3.3µg
2%
Choline
0.4mg
10.1mg
2%
Cholesterol
4mg
1mg
1%
Vitamin A
13µg
2µg
1%
Polyunsaturated fat
1.148g
1.258g
1%
Fructose
0.8g
1%
Protein per 100 calories
6.9g
3.6g
N/A
Calories per 10 g protein
145kcal
280kcal
N/A
Weight per 100 calories
27g
35g
N/A
Unsaturated / Saturated Fat ratio
1.5
1.1
N/A
Net carbs
41.27g
41.41g
N/A
Sugar
0g
3.4g
N/A
Tryptophan
0.266mg
0%
Threonine
0.886mg
0%
Isoleucine
1.303mg
0%
Leucine
2.115mg
0%
Lysine
1.695mg
0%
Methionine
0.372mg
0%
Phenylalanine
1.491mg
0%
Valine
1.434mg
0%
Histidine
0.715mg
0%
Macronutrient Comparison
Macronutrient breakdown side-by-side comparison
3
26%
3%
60%
3%
8%
Protein:
25.56 g
Fats:
3.25 g
Carbs:
59.87 g
Water:
3.49 g
Other:
7.83 g
2
10%
7%
46%
35%
2%
Protein:
10.2 g
Fats:
6.7 g
Carbs:
46.21 g
Water:
34.9 g
Other:
1.99 g
Contains
more
Protein Protein
+150.6%
Contains
more
Carbs Carbs
+29.6%
Contains
more
Other Other
+293.5%
Contains
more
Fats Fats
+106.2%
Contains
more
Water Water
+900%
Fat Type Comparison
Fat type breakdown side-by-side comparison
1
39%
19%
42%
Saturated fat:
Sat. Fat
1.084 g
Monounsaturated fat:
Mono. Fat
0.532 g
Polyunsaturated fat:
Poly. Fat
1.148 g
2
48%
32%
21%
Saturated fat:
Sat. Fat
2.907 g
Monounsaturated fat:
Mono. Fat
1.946 g
Polyunsaturated fat:
Poly. Fat
1.258 g
Contains
less
Sat. Fat Saturated fat
-62.7%
Contains
more
Mono. Fat Monounsaturated fat
+265.8%
~equal in
Polyunsaturated fat
~1.258g