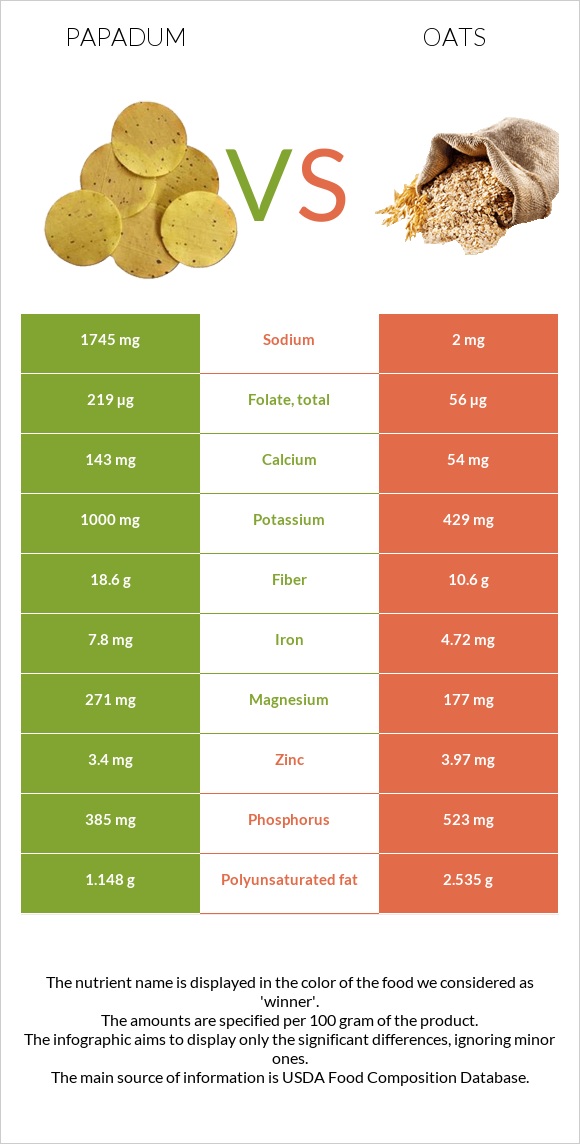
How are papadum and oats different? Papadum is richer in copper, folate, iron, fiber, magnesium, and potassium, while oats are higher in manganese, vitamin B1, and phosphorus. Oats cover your daily need for manganese, 146% more than papadum. Papadum contains 873 times more sodium than oats. Papadum contains 1745mg of sodium, while oats contain 2mg. Oats have a higher glycemic index (59) than papadum (46). Papad and Oats types were used in this article.
Infographic
Mineral Comparison
Mineral comparison score is based on the number of minerals by which one or the other food is richer. The "coverage" charts below show how much of the daily needs can be covered by 300 grams of the food.
6
100 g
300 g
Magnesium
Magnesium
Calcium
Calcium
Potassium
Potassium
Iron
Iron
Copper
Copper
Zinc
Zinc
Phosphorus
Phosphorus
Sodium
Sodium
Manganese
Manganese
Selenium
Selenium
194%
43%
88%
293%
333%
93%
165%
228%
204%
45%
4
100 g
300 g
1 cup - 156g
Magnesium
Magnesium
Calcium
Calcium
Potassium
Potassium
Iron
Iron
Copper
Copper
Zinc
Zinc
Phosphorus
Phosphorus
Sodium
Sodium
Manganese
Manganese
Selenium
Selenium
126%
16%
38%
177%
209%
108%
224%
0.26%
641%
0%
Vitamin Comparison
Vitamin comparison score is based on the number of vitamins by which one or the other food is richer. The "coverage" charts below show how much of the daily needs can be covered by 300 grams of the food.
7
100 g
300 g
Vitamin C
Vit. C
Vitamin D
Vit. D
Vitamin A
Vit. A
Vitamin E
Vit. E
Vitamin B1
Vit. B1
Vitamin B2
Vit. B2
Vitamin B3
Vit. B3
Vitamin B5
Vit. B5
Vitamin B6
Vit. B6
Vitamin B12
Vit. B12
Vitamin K
Vit. K
Folate
Folate
0%
0%
4.3%
1%
69%
60%
28%
55%
66%
0%
1%
164%
2
100 g
300 g
1 cup - 156g
Vitamin C
Vit. C
Vitamin D
Vit. D
Vitamin A
Vit. A
Vitamin E
Vit. E
Vitamin B1
Vit. B1
Vitamin B2
Vit. B2
Vitamin B3
Vit. B3
Vitamin B5
Vit. B5
Vitamin B6
Vit. B6
Vitamin B12
Vit. B12
Vitamin K
Vit. K
Folate
Folate
0%
0%
0%
0%
191%
32%
18%
81%
27%
0%
0%
42%
All nutrients comparison - raw data values
Nutrient
DV% diff.
Manganese
1.562mg
4.916mg
146%
Sodium
1745mg
2mg
76%
Copper
0.998mg
0.626mg
41%
Vitamin B1
0.277mg
0.763mg
41%
Folate
219µg
56µg
41%
Iron
7.8mg
4.72mg
39%
Fiber
18.6g
10.6g
32%
Magnesium
271mg
177mg
22%
Phosphorus
385mg
523mg
20%
Protein
25.56g
16.89g
17%
Potassium
1000mg
429mg
17%
Selenium
8.3µg
15%
Vitamin B6
0.285mg
0.119mg
13%
Calcium
143mg
54mg
9%
Vitamin B2
0.258mg
0.139mg
9%
Vitamin B5
0.917mg
1.349mg
9%
Polyunsaturated fat
1.148g
2.535g
9%
Fats
3.25g
6.9g
6%
Zinc
3.4mg
3.97mg
5%
Monounsaturated fat
0.532g
2.178g
4%
Vitamin B3
1.472mg
0.961mg
3%
Carbs
59.87g
66.27g
2%
Calories
371kcal
389kcal
1%
Cholesterol
4mg
0mg
1%
Vitamin A
13µg
0µg
1%
Saturated fat
1.084g
1.217g
1%
Protein per 100 calories
6.9g
4.3g
N/A
Calories per 10 g protein
145kcal
230kcal
N/A
Weight per 100 calories
27g
26g
N/A
Unsaturated / Saturated Fat ratio
1.5
3.9
N/A
Net carbs
41.27g
55.67g
N/A
Vitamin E
0.05mg
0%
Vitamin K
0.4µg
0%
Choline
0.4mg
0%
Tryptophan
0.266mg
0.234mg
0%
Threonine
0.886mg
0.575mg
0%
Isoleucine
1.303mg
0.694mg
0%
Leucine
2.115mg
1.284mg
0%
Lysine
1.695mg
0.701mg
0%
Methionine
0.372mg
0.312mg
0%
Phenylalanine
1.491mg
0.895mg
0%
Valine
1.434mg
0.937mg
0%
Histidine
0.715mg
0.405mg
0%
Macronutrient Comparison
Macronutrient breakdown side-by-side comparison
2
26%
3%
60%
3%
8%
Protein:
25.56 g
Fats:
3.25 g
Carbs:
59.87 g
Water:
3.49 g
Other:
7.83 g
3
17%
7%
66%
8%
2%
Protein:
16.89 g
Fats:
6.9 g
Carbs:
66.27 g
Water:
8.22 g
Other:
1.72 g
Contains
more
Protein Protein
+51.3%
Contains
more
Other Other
+355.2%
Contains
more
Fats Fats
+112.3%
Contains
more
Carbs Carbs
+10.7%
Contains
more
Water Water
+135.5%
Fat Type Comparison
Fat type breakdown side-by-side comparison
1
39%
19%
42%
Saturated fat:
Sat. Fat
1.084 g
Monounsaturated fat:
Mono. Fat
0.532 g
Polyunsaturated fat:
Poly. Fat
1.148 g
2
21%
37%
43%
Saturated fat:
Sat. Fat
1.217 g
Monounsaturated fat:
Mono. Fat
2.178 g
Polyunsaturated fat:
Poly. Fat
2.535 g
Contains
less
Sat. Fat Saturated fat
-10.9%
Contains
more
Mono. Fat Monounsaturated fat
+309.4%
Contains
more
Poly. Fat Polyunsaturated fat
+120.8%