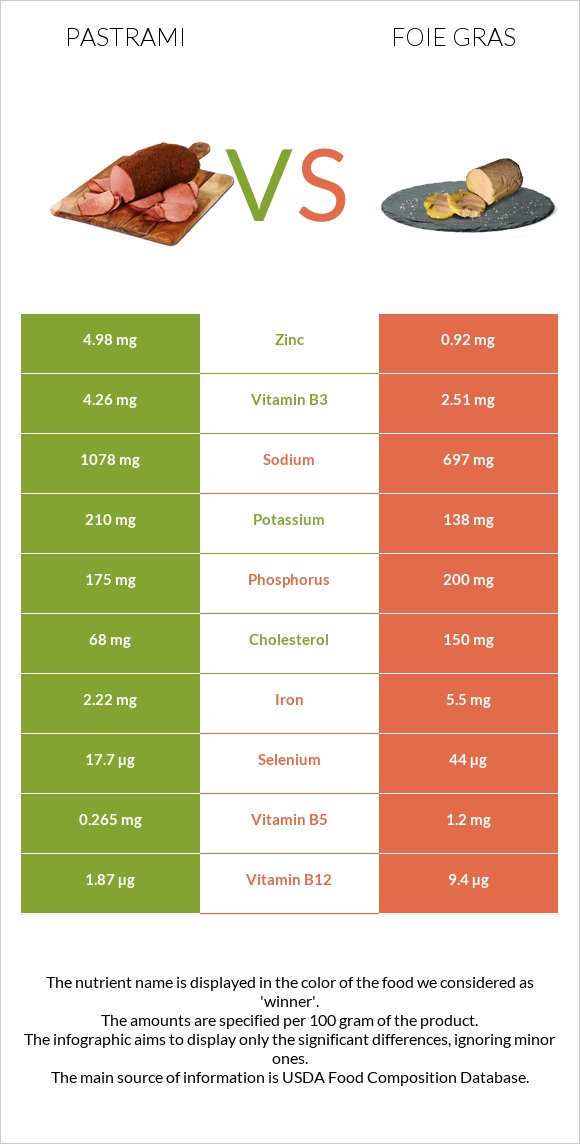
What are the differences between pastrami and foie gras? Pastrami is higher in zinc, yet foie gras is higher in vitamin B12, vitamin A, selenium, iron, copper, and vitamin B5. Foie gras's daily need coverage for vitamin B12 is 314% more. Pastrami has 5 times more zinc than foie gras. While pastrami has 4.98mg of zinc, foie gras has only 0.92mg. The amount of sodium in foie gras is lower. We used Beef, cured, pastrami and Pate de foie gras, canned (goose liver pate), smoked types in this article.
Infographic
Mineral Comparison
Mineral comparison score is based on the number of minerals by which one or the other food is richer. The "coverage" charts below show how much of the daily needs can be covered by 300 grams of the food.
3
100 g
300 g
1 slice (1 oz) - 28g 1 package, 2.5 oz - 71g
Magnesium
Magnesium
Calcium
Calcium
Potassium
Potassium
Iron
Iron
Copper
Copper
Zinc
Zinc
Phosphorus
Phosphorus
Sodium
Sodium
Manganese
Manganese
Selenium
Selenium
12%
3%
19%
83%
30%
136%
75%
141%
3.5%
97%
7
100 g
300 g
1 tbsp - 13g 1 oz - 28.35g
Magnesium
Magnesium
Calcium
Calcium
Potassium
Potassium
Iron
Iron
Copper
Copper
Zinc
Zinc
Phosphorus
Phosphorus
Sodium
Sodium
Manganese
Manganese
Selenium
Selenium
9.3%
21%
12%
206%
133%
25%
86%
91%
16%
240%
Vitamin Comparison
Vitamin comparison score is based on the number of vitamins by which one or the other food is richer. The "coverage" charts below show how much of the daily needs can be covered by 300 grams of the food.
5
100 g
300 g
1 slice (1 oz) - 28g 1 package, 2.5 oz - 71g
Vitamin C
Vit. C
Vitamin D
Vit. D
Vitamin A
Vit. A
Vitamin E
Vit. E
Vitamin B1
Vit. B1
Vitamin B2
Vit. B2
Vitamin B3
Vit. B3
Vitamin B5
Vit. B5
Vitamin B6
Vit. B6
Vitamin B12
Vit. B12
Vitamin K
Vit. K
Folate
Folate
1%
1.5%
0.67%
2.4%
13%
37%
80%
16%
51%
234%
1.8%
4.5%
7
100 g
300 g
1 tbsp - 13g 1 oz - 28.35g
Vitamin C
Vit. C
Vitamin D
Vit. D
Vitamin A
Vit. A
Vitamin E
Vit. E
Vitamin B1
Vit. B1
Vitamin B2
Vit. B2
Vitamin B3
Vit. B3
Vitamin B5
Vit. B5
Vitamin B6
Vit. B6
Vitamin B12
Vit. B12
Vitamin K
Vit. K
Folate
Folate
6.7%
0%
334%
0%
22%
69%
47%
72%
14%
1175%
0%
45%
All nutrients comparison - raw data values
Nutrient
DV% diff.
Vitamin B12
1.87µg
9.4µg
314%
Vitamin A
2µg
1001µg
111%
Monounsaturated fat
2.118g
25.61g
59%
Fats
5.82g
43.84g
58%
Saturated fat
2.681g
14.45g
53%
Selenium
17.7µg
44µg
48%
Iron
2.22mg
5.5mg
41%
Zinc
4.98mg
0.92mg
37%
Copper
0.091mg
0.4mg
34%
Cholesterol
68mg
150mg
27%
Protein
21.8g
11.4g
21%
Vitamin B5
0.265mg
1.2mg
19%
Sodium
1078mg
697mg
17%
Calories
147kcal
462kcal
16%
Choline
81.6mg
15%
Folate
6µg
60µg
14%
Vitamin B6
0.221mg
0.06mg
12%
Vitamin B2
0.161mg
0.299mg
11%
Vitamin B3
4.26mg
2.51mg
11%
Calcium
10mg
70mg
6%
Polyunsaturated fat
0.145g
0.84g
5%
Phosphorus
175mg
200mg
4%
Manganese
0.027mg
0.12mg
4%
Vitamin B1
0.052mg
0.088mg
3%
Vitamin C
0.3mg
2mg
2%
Potassium
210mg
138mg
2%
Carbs
0.36g
4.67g
1%
Vitamin D*
4 IU
1%
Vitamin D
0.1µg
1%
Magnesium
17mg
13mg
1%
Vitamin E
0.12mg
1%
Vitamin K
0.7µg
1%
Protein per 100 calories
15g
2.5g
N/A
Calories per 10 g protein
67kcal
405kcal
N/A
Weight per 100 calories
68g
22g
N/A
Unsaturated / Saturated Fat ratio
0.84
1.8
N/A
Net carbs
0.36g
4.67g
N/A
Sugar
0.1g
N/A
Tryptophan
0.141mg
0.161mg
0%
Threonine
0.857mg
0.507mg
0%
Isoleucine
0.976mg
0.606mg
0%
Leucine
1.706mg
1.029mg
0%
Lysine
1.812mg
0.863mg
0%
Methionine
0.558mg
0.27mg
0%
Phenylalanine
0.847mg
0.567mg
0%
Valine
1.065mg
0.719mg
0%
Histidine
0.684mg
0.303mg
0%
Fructose
0.01g
0%
Macronutrient Comparison
Macronutrient breakdown side-by-side comparison
2
22%
6%
70%
2%
Protein:
21.8 g
Fats:
5.82 g
Carbs:
0.36 g
Water:
69.53 g
Other:
2.49 g
3
11%
44%
5%
37%
3%
Protein:
11.4 g
Fats:
43.84 g
Carbs:
4.67 g
Water:
37.04 g
Other:
3.05 g
Contains
more
Protein Protein
+91.2%
Contains
more
Water Water
+87.7%
Contains
more
Fats Fats
+653.3%
Contains
more
Carbs Carbs
+1197.2%
Contains
more
Other Other
+22.5%
Fat Type Comparison
Fat type breakdown side-by-side comparison
1
54%
43%
3%
Saturated fat:
Sat. Fat
2.681 g
Monounsaturated fat:
Mono. Fat
2.118 g
Polyunsaturated fat:
Poly. Fat
0.145 g
2
35%
63%
2%
Saturated fat:
Sat. Fat
14.45 g
Monounsaturated fat:
Mono. Fat
25.61 g
Polyunsaturated fat:
Poly. Fat
0.84 g
Contains
less
Sat. Fat Saturated fat
-81.4%
Contains
more
Mono. Fat Monounsaturated fat
+1109.2%
Contains
more
Poly. Fat Polyunsaturated fat
+479.3%