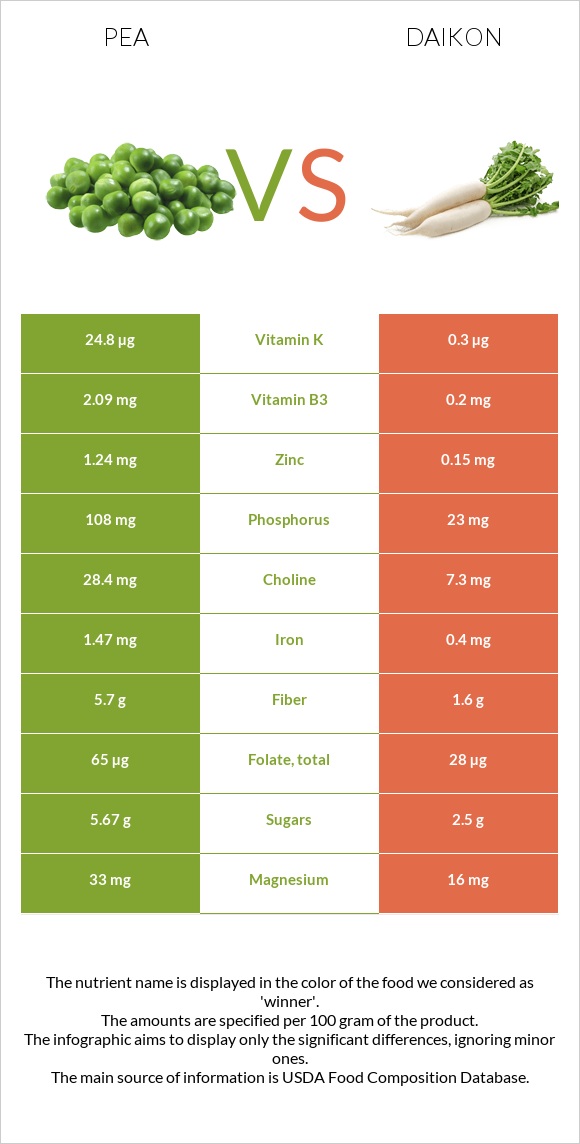
A recap on the differences between peas and daikon Daikon has less vitamin B5, vitamin K, manganese, vitamin B1, vitamin A, fiber, iron, phosphorus, vitamin B6, and vitamin B3. Peas cover your daily vitamin B5 needs 3057% more than daikon. The glycemic index of peas is higher. Food varieties used in this article are Peas, green, cooked, boiled, drained, without salt and Radishes, oriental, raw .
Infographic
Mineral Comparison
Mineral comparison score is based on the number of minerals by which one or the other food is richer. The "coverage" charts below show how much of the daily needs can be covered by 300 grams of the food.
9
100 g
300 g
1 cup - 160g
Magnesium
Magnesium
Calcium
Calcium
Potassium
Potassium
Iron
Iron
Copper
Copper
Zinc
Zinc
Phosphorus
Phosphorus
Sodium
Sodium
Manganese
Manganese
Selenium
Selenium
28%
8.1%
24%
58%
58%
32%
50%
0.39%
68%
10%
0
100 g
300 g
1 cup slices - 116g 1 radish (7" long) - 338g
Magnesium
Magnesium
Calcium
Calcium
Potassium
Potassium
Iron
Iron
Copper
Copper
Zinc
Zinc
Phosphorus
Phosphorus
Sodium
Sodium
Manganese
Manganese
Selenium
Selenium
11%
8.1%
20%
15%
38%
4.1%
9.9%
2.7%
5%
3.8%
Vitamin Comparison
Vitamin comparison score is based on the number of vitamins by which one or the other food is richer. The "coverage" charts below show how much of the daily needs can be covered by 300 grams of the food.
9
100 g
300 g
1 cup - 160g
Vitamin C
Vit. C
Vitamin D
Vit. D
Vitamin A
Vit. A
Vitamin E
Vit. E
Vitamin B1
Vit. B1
Vitamin B2
Vit. B2
Vitamin B3
Vit. B3
Vitamin B5
Vit. B5
Vitamin B6
Vit. B6
Vitamin B12
Vit. B12
Vitamin K
Vit. K
Folate
Folate
47%
0%
13%
2.8%
65%
34%
38%
9180%
50%
0%
65%
47%
1
100 g
300 g
1 cup slices - 116g 1 radish (7" long) - 338g
Vitamin C
Vit. C
Vitamin D
Vit. D
Vitamin A
Vit. A
Vitamin E
Vit. E
Vitamin B1
Vit. B1
Vitamin B2
Vit. B2
Vitamin B3
Vit. B3
Vitamin B5
Vit. B5
Vitamin B6
Vit. B6
Vitamin B12
Vit. B12
Vitamin K
Vit. K
Folate
Folate
73%
0%
0%
0%
5%
4.6%
3.8%
8.3%
11%
0%
0.75%
21%
All nutrients comparison - raw data values
Nutrient
DV% diff.
Vitamin B5
153mg
0.138mg
3057%
Manganese
0.525mg
0.038mg
21%
Vitamin K
25.9µg
0.3µg
21%
Vitamin B1
0.259mg
0.02mg
20%
Fiber
5.5g
1.6g
16%
Iron
1.54mg
0.4mg
14%
Phosphorus
117mg
23mg
13%
Vitamin B6
0.216mg
0.046mg
13%
Vitamin B3
2.021mg
0.2mg
11%
Protein
5.36g
0.6g
10%
Vitamin B2
0.149mg
0.02mg
10%
Vitamin C
14.2mg
22mg
9%
Zinc
1.19mg
0.15mg
9%
Folate
63µg
28µg
9%
Copper
0.173mg
0.115mg
6%
Magnesium
39mg
16mg
5%
Carbs
15.63g
4.1g
4%
Vitamin A
40µg
0µg
4%
Choline
29.7mg
7.3mg
4%
Calories
84kcal
18kcal
3%
Selenium
1.9µg
0.7µg
2%
Potassium
271mg
227mg
1%
Sodium
3mg
21mg
1%
Vitamin E
0.14mg
0mg
1%
Fructose
0.41g
1%
Protein per 100 calories
6.4g
3.3g
N/A
Calories per 10 g protein
157kcal
300kcal
N/A
Weight per 100 calories
119g
556g
N/A
Fats
0.22g
0.1g
0%
Net carbs
10.13g
2.5g
N/A
Calcium
27mg
27mg
0%
Sugar
5.93g
2.5g
N/A
Saturated fat
0.039g
0.03g
0%
Monounsaturated fat
0.019g
0.017g
0%
Polyunsaturated fat
0.102g
0.045g
0%
Tryptophan
0.037mg
0.003mg
0%
Threonine
0.201mg
0.025mg
0%
Isoleucine
0.193mg
0.026mg
0%
Leucine
0.32mg
0.031mg
0%
Lysine
0.314mg
0.03mg
0%
Methionine
0.081mg
0.006mg
0%
Phenylalanine
0.198mg
0.02mg
0%
Valine
0.232mg
0.028mg
0%
Histidine
0.105mg
0.011mg
0%
Macronutrient Comparison
Macronutrient breakdown side-by-side comparison
4
5%
16%
78%
Protein:
5.36 g
Fats:
0.22 g
Carbs:
15.63 g
Water:
77.87 g
Other:
0.92 g
1
4%
95%
Protein:
0.6 g
Fats:
0.1 g
Carbs:
4.1 g
Water:
94.62 g
Other:
0.58 g
Contains
more
Protein Protein
+793.3%
Contains
more
Fats Fats
+120%
Contains
more
Carbs Carbs
+281.2%
Contains
more
Other Other
+58.6%
Contains
more
Water Water
+21.5%
Fat Type Comparison
Fat type breakdown side-by-side comparison
2
24%
12%
64%
Saturated fat:
Sat. Fat
0.039 g
Monounsaturated fat:
Mono. Fat
0.019 g
Polyunsaturated fat:
Poly. Fat
0.102 g
1
33%
18%
49%
Saturated fat:
Sat. Fat
0.03 g
Monounsaturated fat:
Mono. Fat
0.017 g
Polyunsaturated fat:
Poly. Fat
0.045 g
Contains
more
Mono. Fat Monounsaturated fat
+11.8%
Contains
more
Poly. Fat Polyunsaturated fat
+126.7%
Contains
less
Sat. Fat Saturated fat
-23.1%