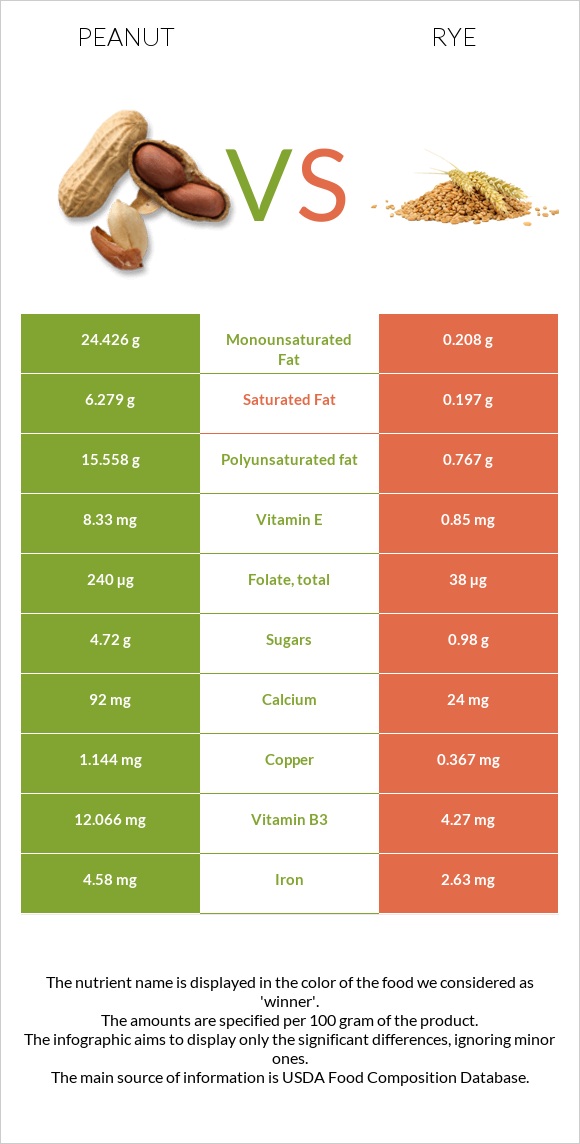
How are peanuts and rye different? Peanuts are higher in copper, folate, vitamin E, vitamin B3, vitamin B1, iron, and magnesium; however, rye is richer in manganese and fiber. Daily need coverage for copper for peanuts is 86% higher. Peanuts contain 32 times more saturated fat than rye. While peanuts contain 6.279g of saturated fat, rye contains only 0.197g. Peanuts have a lower glycemic index (13) than rye (34). Peanuts, all types, raw and Rye grain are the varieties used in this article.
Infographic
Mineral Comparison
Mineral comparison score is based on the number of minerals by which one or the other food is richer. The "coverage" charts below show how much of the daily needs can be covered by 300 grams of the food.
7
100 g
300 g
1 oz - 28.35g 1 cup - 146g
Magnesium
Magnesium
Calcium
Calcium
Potassium
Potassium
Iron
Iron
Copper
Copper
Zinc
Zinc
Phosphorus
Phosphorus
Sodium
Sodium
Manganese
Manganese
Selenium
Selenium
120%
28%
62%
172%
381%
89%
161%
2.3%
252%
39%
3
100 g
300 g
1 cup - 169g
Magnesium
Magnesium
Calcium
Calcium
Potassium
Potassium
Iron
Iron
Copper
Copper
Zinc
Zinc
Phosphorus
Phosphorus
Sodium
Sodium
Manganese
Manganese
Selenium
Selenium
79%
7.2%
45%
99%
122%
72%
142%
0.26%
336%
76%
Vitamin Comparison
Vitamin comparison score is based on the number of vitamins by which one or the other food is richer. The "coverage" charts below show how much of the daily needs can be covered by 300 grams of the food.
6
100 g
300 g
1 oz - 28.35g 1 cup - 146g
Vitamin C
Vit. C
Vitamin D
Vit. D
Vitamin A
Vit. A
Vitamin E
Vit. E
Vitamin B1
Vit. B1
Vitamin B2
Vit. B2
Vitamin B3
Vit. B3
Vitamin B5
Vit. B5
Vitamin B6
Vit. B6
Vitamin B12
Vit. B12
Vitamin K
Vit. K
Folate
Folate
0%
0%
0%
167%
160%
31%
226%
106%
80%
0%
0%
180%
3
100 g
300 g
1 cup - 169g
Vitamin C
Vit. C
Vitamin D
Vit. D
Vitamin A
Vit. A
Vitamin E
Vit. E
Vitamin B1
Vit. B1
Vitamin B2
Vit. B2
Vitamin B3
Vit. B3
Vitamin B5
Vit. B5
Vitamin B6
Vit. B6
Vitamin B12
Vit. B12
Vitamin K
Vit. K
Folate
Folate
0%
0%
0.33%
17%
79%
58%
80%
87%
68%
0%
15%
29%
All nutrients comparison - raw data values
Nutrient
DV% diff.
Polyunsaturated fat
15.558g
0.767g
99%
Copper
1.144mg
0.367mg
86%
Fats
49.24g
1.63g
73%
Monounsaturated fat
24.426g
0.208g
61%
Folate
240µg
38µg
51%
Vitamin E
8.33mg
0.85mg
50%
Vitamin B3
12.066mg
4.27mg
49%
Protein
25.8g
10.34g
31%
Manganese
1.934mg
2.577mg
28%
Saturated fat
6.279g
0.197g
28%
Vitamin B1
0.64mg
0.316mg
27%
Fiber
8.5g
15.1g
26%
Iron
4.58mg
2.63mg
24%
Carbs
16.13g
75.86g
20%
Magnesium
168mg
110mg
14%
Selenium
7.2µg
13.9µg
12%
Calories
567kcal
338kcal
11%
Vitamin B2
0.135mg
0.251mg
9%
Calcium
92mg
24mg
7%
Potassium
705mg
510mg
6%
Zinc
3.27mg
2.65mg
6%
Phosphorus
376mg
332mg
6%
Vitamin B5
1.767mg
1.456mg
6%
Vitamin K
0µg
5.9µg
5%
Vitamin B6
0.348mg
0.294mg
4%
Choline
52.5mg
30.4mg
4%
Sodium
18mg
2mg
1%
Protein per 100 calories
4.6g
3.1g
N/A
Calories per 10 g protein
220kcal
327kcal
N/A
Weight per 100 calories
18g
30g
N/A
Unsaturated / Saturated Fat ratio
6.4
4.9
N/A
Net carbs
7.63g
60.76g
N/A
Sugar
4.72g
0.98g
N/A
Vitamin A
0µg
1µg
0%
Tryptophan
0.25mg
0.108mg
0%
Threonine
0.883mg
0.289mg
0%
Isoleucine
0.907mg
0.208mg
0%
Leucine
1.672mg
0.563mg
0%
Lysine
0.926mg
0.286mg
0%
Methionine
0.317mg
0.153mg
0%
Phenylalanine
1.377mg
0.435mg
0%
Valine
1.082mg
0.317mg
0%
Histidine
0.652mg
0.189mg
0%
Fructose
0.11g
0%
Macronutrient Comparison
Macronutrient breakdown side-by-side comparison
3
26%
49%
16%
7%
2%
Protein:
25.8 g
Fats:
49.24 g
Carbs:
16.13 g
Water:
6.5 g
Other:
2.33 g
2
10%
76%
11%
Protein:
10.34 g
Fats:
1.63 g
Carbs:
75.86 g
Water:
10.6 g
Other:
1.57 g
Contains
more
Protein Protein
+149.5%
Contains
more
Fats Fats
+2920.9%
Contains
more
Other Other
+48.4%
Contains
more
Carbs Carbs
+370.3%
Contains
more
Water Water
+63.1%
Fat Type Comparison
Fat type breakdown side-by-side comparison
2
14%
53%
34%
Saturated fat:
Sat. Fat
6.279 g
Monounsaturated fat:
Mono. Fat
24.426 g
Polyunsaturated fat:
Poly. Fat
15.558 g
1
17%
18%
65%
Saturated fat:
Sat. Fat
0.197 g
Monounsaturated fat:
Mono. Fat
0.208 g
Polyunsaturated fat:
Poly. Fat
0.767 g
Contains
more
Mono. Fat Monounsaturated fat
+11643.3%
Contains
more
Poly. Fat Polyunsaturated fat
+1928.4%
Contains
less
Sat. Fat Saturated fat
-96.9%