Peanut butter vs. Cayenne pepper — In-Depth Nutrition Comparison
Compare
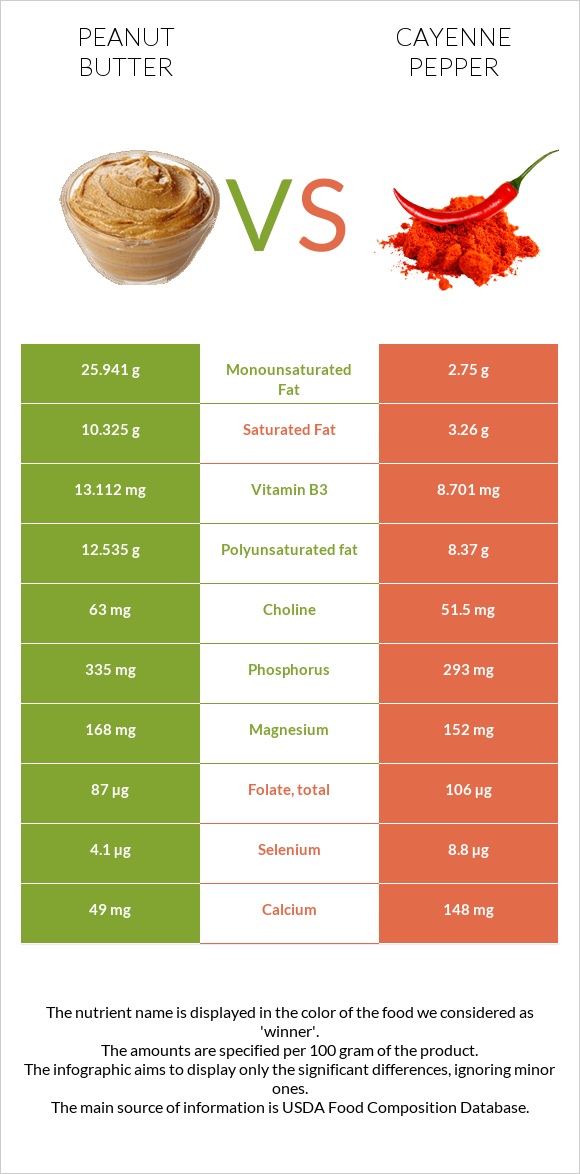
How are peanut butter and cayenne pepper different?
- Cayenne pepper has more vitamin A, vitamin B6, vitamin E, fiber, vitamin C, iron, vitamin K, vitamin B2, and potassium than peanut butter.
- Daily need coverage for vitamin A for cayenne pepper is 832% higher.
- Peanut butter contains 3 times more saturated fat than cayenne pepper. While peanut butter contains 10.325g of saturated fat, cayenne pepper contains only 3.26g.
- Peanut butter has a lower glycemic index (14) than cayenne pepper (32).
Peanut butter, smooth style, without salt and Spices, pepper, red or cayenne are the varieties used in this article.
Infographic
Infographic link
Mineral Comparison
Mineral comparison score is based on the number of minerals by which one or the other food is richer. The "coverage" charts below show how much of the daily needs can be covered by 300 grams of the food.
| Contains more CopperCopper | +13.1% |
| Contains more PhosphorusPhosphorus | +14.3% |
| Contains less SodiumSodium | -43.3% |
| Contains more CalciumCalcium | +202% |
| Contains more PotassiumPotassium | +260.9% |
| Contains more IronIron | +348.3% |
| Contains more ManganeseManganese | +20.1% |
| Contains more SeleniumSelenium | +114.6% |
Vitamin Comparison
Vitamin comparison score is based on the number of vitamins by which one or the other food is richer. The "coverage" charts below show how much of the daily needs can be covered by 300 grams of the food.
| Contains more Vitamin B3Vitamin B3 | +50.7% |
| Contains more Vitamin B5Vitamin B5 | +∞% |
| Contains more Vitamin CVitamin C | +∞% |
| Contains more Vitamin AVitamin A | +∞% |
| Contains more Vitamin EVitamin E | +227.8% |
| Contains more Vitamin B1Vitamin B1 | +118.7% |
| Contains more Vitamin B2Vitamin B2 | +378.6% |
| Contains more Vitamin B6Vitamin B6 | +455.6% |
| Contains more Vitamin KVitamin K | +26666.7% |
| Contains more FolateFolate | +21.8% |
All nutrients comparison - raw data values
| Nutrient |  |
 |
DV% diff. |
| Vitamin A | 0µg | 2081µg | 231% |
| Vitamin B6 | 0.441mg | 2.45mg | 155% |
| Vitamin E | 9.1mg | 29.83mg | 138% |
| Fiber | 5g | 27.2g | 89% |
| Vitamin C | 0mg | 76.4mg | 85% |
| Iron | 1.74mg | 7.8mg | 76% |
| Vitamin K | 0.3µg | 80.3µg | 67% |
| Monounsaturated fat | 25.941g | 2.75g | 58% |
| Vitamin B2 | 0.192mg | 0.919mg | 56% |
| Fats | 51.36g | 17.27g | 52% |
| Potassium | 558mg | 2014mg | 43% |
| Saturated fat | 10.325g | 3.26g | 32% |
| Vitamin B3 | 13.112mg | 8.701mg | 28% |
| Polyunsaturated fat | 12.535g | 8.37g | 28% |
| Vitamin B5 | 1.137mg | 23% | |
| Protein | 22.21g | 12.01g | 20% |
| Manganese | 1.665mg | 2mg | 15% |
| Vitamin B1 | 0.15mg | 0.328mg | 15% |
| Calories | 598kcal | 318kcal | 14% |
| Carbs | 22.31g | 56.63g | 11% |
| Calcium | 49mg | 148mg | 10% |
| Selenium | 4.1µg | 8.8µg | 9% |
| Phosphorus | 335mg | 293mg | 6% |
| Copper | 0.422mg | 0.373mg | 5% |
| Folate | 87µg | 106µg | 5% |
| Magnesium | 168mg | 152mg | 4% |
| Choline | 63mg | 51.5mg | 2% |
| Starch | 3.56g | 1% | |
| Sodium | 17mg | 30mg | 1% |
| Protein per 100 calories | 3.7g | 3.8g | N/A |
| Calories per 10 g protein | 269kcal | 265kcal | N/A |
| Weight per 100 calories | 17g | 31g | N/A |
| Unsaturated / Saturated Fat ratio | 3.7 | 3.4 | N/A |
| Net carbs | 17.31g | 29.43g | N/A |
| Sugar | 10.49g | 10.34g | N/A |
| Zinc | 2.51mg | 2.48mg | 0% |
| Trans fat | 0.075g | N/A | |
| Tryptophan | 0.231mg | 0% | |
| Threonine | 0.525mg | 0% | |
| Isoleucine | 0.616mg | 0% | |
| Leucine | 1.546mg | 0% | |
| Lysine | 0.681mg | 0% | |
| Methionine | 0.265mg | 0% | |
| Phenylalanine | 1.202mg | 0% | |
| Valine | 0.782mg | 0% | |
| Histidine | 0.557mg | 0% | |
| Fructose | 0.12g | 0% | |
| Omega-3 - ALA | 0.027g | N/A | |
| Omega-3 - Eicosatrienoic acid | 0.01g | N/A | |
| Omega-6 - Gamma-linoleic acid | 0.001g | N/A | |
| Omega-6 - Eicosadienoic acid | 0.008g | N/A | |
| Omega-6 - Linoleic acid | 12.215g | N/A |
Macronutrient Comparison
Macronutrient breakdown side-by-side comparison
Protein:
22.21 g
Fats:
51.36 g
Carbs:
22.31 g
Water:
1.23 g
Other:
2.89 g
Protein:
12.01 g
Fats:
17.27 g
Carbs:
56.63 g
Water:
8.05 g
Other:
6.04 g
| Contains more ProteinProtein | +84.9% |
| Contains more FatsFats | +197.4% |
| Contains more CarbsCarbs | +153.8% |
| Contains more WaterWater | +554.5% |
| Contains more OtherOther | +109% |
Fat Type Comparison
Fat type breakdown side-by-side comparison
Saturated fat:
Sat. Fat
10.325 g
Monounsaturated fat:
Mono. Fat
25.941 g
Polyunsaturated fat:
Poly. Fat
12.535 g
Saturated fat:
Sat. Fat
3.26 g
Monounsaturated fat:
Mono. Fat
2.75 g
Polyunsaturated fat:
Poly. Fat
8.37 g
| Contains more Mono. FatMonounsaturated fat | +843.3% |
| Contains more Poly. FatPolyunsaturated fat | +49.8% |
| Contains less Sat. FatSaturated fat | -68.4% |


