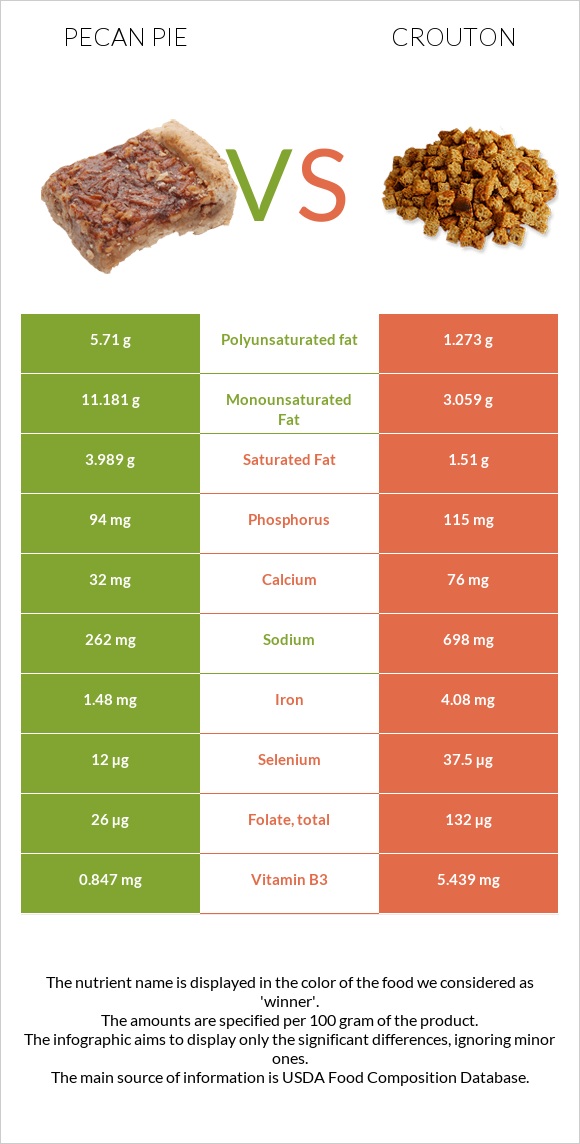
What are the differences between pecan pie and crouton? Pecan pie is higher in manganese and vitamin A, yet crouton is higher in selenium, vitamin B1, iron, vitamin B3, and folate. Crouton's daily need coverage for selenium is 46% more. The glycemic index of pecan pie is lower. We used Pie, pecan, prepared from recipe and Croutons, plain types in this article.
Infographic
Mineral Comparison
Mineral comparison score is based on the number of minerals by which one or the other food is richer. The "coverage" charts below show how much of the daily needs can be covered by 300 grams of the food.
4
100 g
300 g
1 oz - 28.35g 1 piece (1/8 of 9" dia) - 122g
Magnesium
Magnesium
Calcium
Calcium
Potassium
Potassium
Iron
Iron
Copper
Copper
Zinc
Zinc
Phosphorus
Phosphorus
Sodium
Sodium
Manganese
Manganese
Selenium
Selenium
19%
9.6%
12%
56%
70%
28%
40%
34%
93%
65%
5
100 g
300 g
0.5 oz - 14.2g 1 cup - 30g
Magnesium
Magnesium
Calcium
Calcium
Potassium
Potassium
Iron
Iron
Copper
Copper
Zinc
Zinc
Phosphorus
Phosphorus
Sodium
Sodium
Manganese
Manganese
Selenium
Selenium
22%
23%
11%
153%
54%
24%
49%
91%
65%
205%
Vitamin Comparison
Vitamin comparison score is based on the number of vitamins by which one or the other food is richer. The "coverage" charts below show how much of the daily needs can be covered by 300 grams of the food.
5
100 g
300 g
1 oz - 28.35g 1 piece (1/8 of 9" dia) - 122g
Vitamin C
Vit. C
Vitamin D
Vit. D
Vitamin A
Vit. A
Vitamin E
Vit. E
Vitamin B1
Vit. B1
Vitamin B2
Vit. B2
Vitamin B3
Vit. B3
Vitamin B5
Vit. B5
Vitamin B6
Vit. B6
Vitamin B12
Vit. B12
Vitamin K
Vit. K
Folate
Folate
0.67%
0%
27%
0%
47%
42%
16%
29%
14%
21%
0%
20%
4
100 g
300 g
0.5 oz - 14.2g 1 cup - 30g
Vitamin C
Vit. C
Vitamin D
Vit. D
Vitamin A
Vit. A
Vitamin E
Vit. E
Vitamin B1
Vit. B1
Vitamin B2
Vit. B2
Vitamin B3
Vit. B3
Vitamin B5
Vit. B5
Vitamin B6
Vit. B6
Vitamin B12
Vit. B12
Vitamin K
Vit. K
Folate
Folate
0%
0%
0%
0%
156%
63%
102%
26%
6%
0%
0%
99%
All nutrients comparison - raw data values
Nutrient
DV% diff.
Selenium
12µg
37.5µg
46%
Vitamin B1
0.188mg
0.623mg
36%
Iron
1.48mg
4.08mg
33%
Polyunsaturated fat
5.71g
1.273g
30%
Cholesterol
87mg
0mg
29%
Vitamin B3
0.847mg
5.439mg
29%
Folate
26µg
132µg
27%
Fats
22.2g
6.6g
24%
Fiber
5.1g
20%
Monounsaturated fat
11.181g
3.059g
20%
Sodium
262mg
698mg
19%
Protein
4.9g
11.9g
14%
Saturated fat
3.989g
1.51g
11%
Vitamin A
82µg
0µg
9%
Manganese
0.712mg
0.5mg
9%
Carbs
52.2g
73.5g
7%
Vitamin B2
0.18mg
0.272mg
7%
Vitamin B12
0.17µg
0µg
7%
Copper
0.211mg
0.163mg
5%
Calcium
32mg
76mg
4%
Phosphorus
94mg
115mg
3%
Vitamin B6
0.06mg
0.026mg
3%
Magnesium
26mg
31mg
1%
Zinc
1.02mg
0.89mg
1%
Vitamin B5
0.479mg
0.429mg
1%
Calories
412kcal
407kcal
0%
Protein per 100 calories
1.2g
2.9g
N/A
Calories per 10 g protein
841kcal
342kcal
N/A
Weight per 100 calories
24g
25g
N/A
Unsaturated / Saturated Fat ratio
4.2
2.9
N/A
Vitamin C
0.2mg
0mg
0%
Net carbs
52.2g
68.4g
N/A
Potassium
133mg
124mg
0%
Tryptophan
0.069mg
0.14mg
0%
Threonine
0.189mg
0.337mg
0%
Isoleucine
0.223mg
0.456mg
0%
Leucine
0.372mg
0.832mg
0%
Lysine
0.248mg
0.278mg
0%
Methionine
0.125mg
0.211mg
0%
Phenylalanine
0.25mg
0.586mg
0%
Valine
0.255mg
0.514mg
0%
Histidine
0.116mg
0.255mg
0%
Omega-3 - EPA
0.001g
0g
N/A
Omega-3 - DHA
0.008g
0g
N/A
Macronutrient Comparison
Macronutrient breakdown side-by-side comparison
2
5%
22%
52%
20%
Protein:
4.9 g
Fats:
22.2 g
Carbs:
52.2 g
Water:
19.5 g
Other:
1.2 g
3
12%
7%
74%
6%
3%
Protein:
11.9 g
Fats:
6.6 g
Carbs:
73.5 g
Water:
5.5 g
Other:
2.5 g
Contains
more
Fats Fats
+236.4%
Contains
more
Water Water
+254.5%
Contains
more
Protein Protein
+142.9%
Contains
more
Carbs Carbs
+40.8%
Contains
more
Other Other
+108.3%
Fat Type Comparison
Fat type breakdown side-by-side comparison
2
19%
54%
27%
Saturated fat:
Sat. Fat
3.989 g
Monounsaturated fat:
Mono. Fat
11.181 g
Polyunsaturated fat:
Poly. Fat
5.71 g
1
26%
52%
22%
Saturated fat:
Sat. Fat
1.51 g
Monounsaturated fat:
Mono. Fat
3.059 g
Polyunsaturated fat:
Poly. Fat
1.273 g
Contains
more
Mono. Fat Monounsaturated fat
+265.5%
Contains
more
Poly. Fat Polyunsaturated fat
+348.5%
Contains
less
Sat. Fat Saturated fat
-62.1%