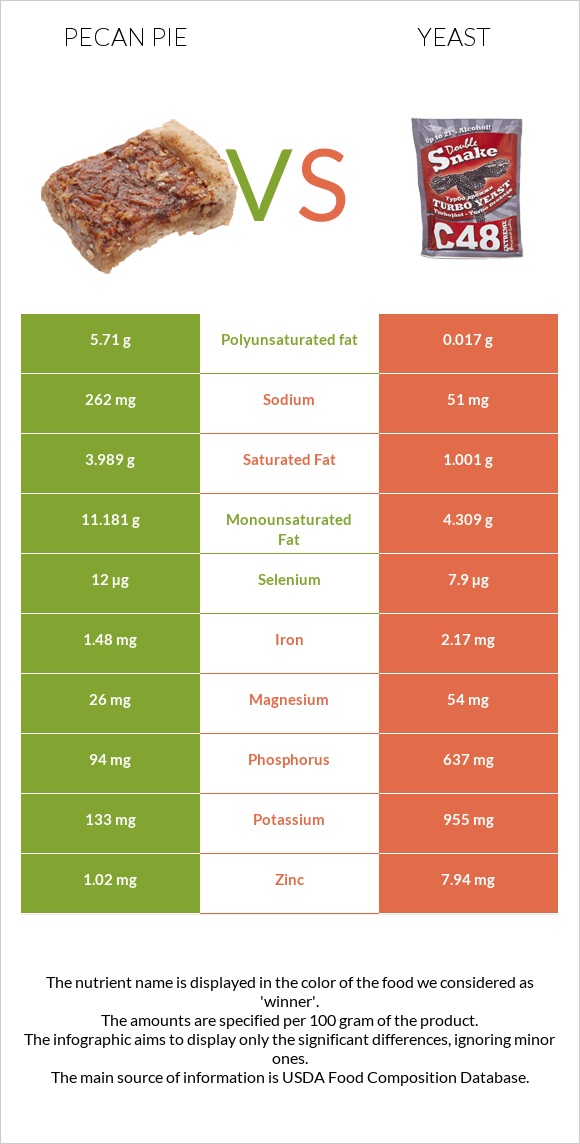
Significant differences between pecan pie and yeast The amount of vitamin B1, folate, vitamin B2, vitamin B5, vitamin B3, vitamin B6, phosphorus, zinc, and copper in yeast is higher than in pecan pie. Yeast covers your daily vitamin B1 needs 900% more than pecan pie. Specific food types used in this comparison are Pie, pecan, prepared from recipe and Leavening agents, yeast, baker's, active dry .
Infographic
Mineral Comparison
Mineral comparison score is based on the number of minerals by which one or the other food is richer. The "coverage" charts below show how much of the daily needs can be covered by 300 grams of the food.
2
100 g
300 g
1 oz - 28.35g 1 piece (1/8 of 9" dia) - 122g
Magnesium
Magnesium
Calcium
Calcium
Potassium
Potassium
Iron
Iron
Copper
Copper
Zinc
Zinc
Phosphorus
Phosphorus
Sodium
Sodium
Manganese
Manganese
Selenium
Selenium
19%
9.6%
12%
56%
70%
28%
40%
34%
93%
65%
7
100 g
300 g
1 tsp - 4g 1 packet - 7.2g 1 tbsp - 12g
Magnesium
Magnesium
Calcium
Calcium
Potassium
Potassium
Iron
Iron
Copper
Copper
Zinc
Zinc
Phosphorus
Phosphorus
Sodium
Sodium
Manganese
Manganese
Selenium
Selenium
39%
9%
84%
81%
145%
217%
273%
6.7%
41%
43%
Vitamin Comparison
Vitamin comparison score is based on the number of vitamins by which one or the other food is richer. The "coverage" charts below show how much of the daily needs can be covered by 300 grams of the food.
2
100 g
300 g
1 oz - 28.35g 1 piece (1/8 of 9" dia) - 122g
Vitamin C
Vit. C
Vitamin D
Vit. D
Vitamin A
Vit. A
Vitamin E
Vit. E
Vitamin B1
Vit. B1
Vitamin B2
Vit. B2
Vitamin B3
Vit. B3
Vitamin B5
Vit. B5
Vitamin B6
Vit. B6
Vitamin B12
Vit. B12
Vitamin K
Vit. K
Folate
Folate
0.67%
0%
27%
0%
47%
42%
16%
29%
14%
21%
0%
20%
8
100 g
300 g
1 tsp - 4g 1 packet - 7.2g 1 tbsp - 12g
Vitamin C
Vit. C
Vitamin D
Vit. D
Vitamin A
Vit. A
Vitamin E
Vit. E
Vitamin B1
Vit. B1
Vitamin B2
Vit. B2
Vitamin B3
Vit. B3
Vitamin B5
Vit. B5
Vitamin B6
Vit. B6
Vitamin B12
Vit. B12
Vitamin K
Vit. K
Folate
Folate
1%
0%
0%
0%
2748%
923%
754%
810%
346%
8.8%
1%
1755%
All nutrients comparison - raw data values
Nutrient
DV% diff.
Vitamin B1
0.188mg
10.99mg
900%
Folate
26µg
2340µg
579%
Vitamin B2
0.18mg
4mg
294%
Vitamin B5
0.479mg
13.5mg
260%
Vitamin B3
0.847mg
40.2mg
246%
Vitamin B6
0.06mg
1.5mg
111%
Fiber
26.9g
108%
Phosphorus
94mg
637mg
78%
Protein
4.9g
40.44g
71%
Zinc
1.02mg
7.94mg
63%
Polyunsaturated fat
5.71g
0.017g
38%
Cholesterol
87mg
0mg
29%
Copper
0.211mg
0.436mg
25%
Potassium
133mg
955mg
24%
Fats
22.2g
7.61g
22%
Manganese
0.712mg
0.312mg
17%
Monounsaturated fat
11.181g
4.309g
17%
Saturated fat
3.989g
1.001g
14%
Iron
1.48mg
2.17mg
9%
Sodium
262mg
51mg
9%
Vitamin A
82µg
0µg
9%
Magnesium
26mg
54mg
7%
Selenium
12µg
7.9µg
7%
Choline
32mg
6%
Calories
412kcal
325kcal
4%
Carbs
52.2g
41.22g
4%
Vitamin B12
0.17µg
0.07µg
4%
Protein per 100 calories
1.2g
12g
N/A
Calories per 10 g protein
841kcal
80kcal
N/A
Weight per 100 calories
24g
31g
N/A
Unsaturated / Saturated Fat ratio
4.2
4.3
N/A
Vitamin C
0.2mg
0.3mg
0%
Net carbs
52.2g
14.32g
N/A
Calcium
32mg
30mg
0%
Vitamin K
0.4µg
0%
Tryptophan
0.069mg
0.54mg
0%
Threonine
0.189mg
1.99mg
0%
Isoleucine
0.223mg
1.89mg
0%
Leucine
0.372mg
2.92mg
0%
Lysine
0.248mg
3.28mg
0%
Methionine
0.125mg
0.59mg
0%
Phenylalanine
0.25mg
1.75mg
0%
Valine
0.255mg
2.31mg
0%
Histidine
0.116mg
0.91mg
0%
Omega-3 - EPA
0.001g
0g
N/A
Omega-3 - DHA
0.008g
0g
N/A
Macronutrient Comparison
Macronutrient breakdown side-by-side comparison
3
5%
22%
52%
20%
Protein:
4.9 g
Fats:
22.2 g
Carbs:
52.2 g
Water:
19.5 g
Other:
1.2 g
2
40%
8%
41%
5%
6%
Protein:
40.44 g
Fats:
7.61 g
Carbs:
41.22 g
Water:
5.08 g
Other:
5.65 g
Contains
more
Fats Fats
+191.7%
Contains
more
Carbs Carbs
+26.6%
Contains
more
Water Water
+283.9%
Contains
more
Protein Protein
+725.3%
Contains
more
Other Other
+370.8%
Fat Type Comparison
Fat type breakdown side-by-side comparison
2
19%
54%
27%
Saturated fat:
Sat. Fat
3.989 g
Monounsaturated fat:
Mono. Fat
11.181 g
Polyunsaturated fat:
Poly. Fat
5.71 g
1
19%
81%
Saturated fat:
Sat. Fat
1.001 g
Monounsaturated fat:
Mono. Fat
4.309 g
Polyunsaturated fat:
Poly. Fat
0.017 g
Contains
more
Mono. Fat Monounsaturated fat
+159.5%
Contains
more
Poly. Fat Polyunsaturated fat
+33488.2%
Contains
less
Sat. Fat Saturated fat
-74.9%