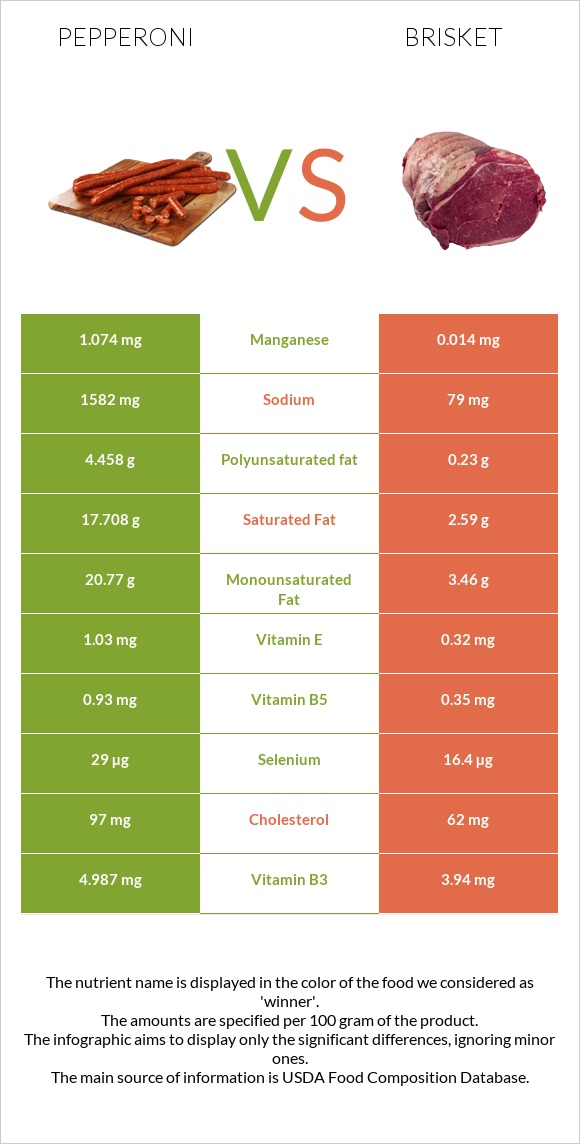
Summary of differences between pepperoni and brisket Pepperoni has more manganese, vitamin B1, vitamin B5, and vitamin B2; however, brisket is higher in zinc, vitamin B12, iron, and choline. Pepperoni covers your daily need for sodium, 67% more than brisket. Pepperoni has 107 times more manganese than brisket. While pepperoni has 1.074mg of manganese, brisket has only 0.01mg. Brisket has less sodium. The glycemic index of pepperoni is higher. These are the specific foods used in this comparison Pepperoni, beef, and pork, sliced and Beef, brisket, flat half, separable lean, and fat, trimmed to 1/8" fat, all grades, cooked, braised .
Infographic
Mineral Comparison
Mineral comparison score is based on the number of minerals by which one or the other food is richer. The "coverage" charts below show how much of the daily needs can be covered by 300 grams of the food.
3
100 g
300 g
1 piece - 2g 1 oz - 28g 3 oz - 85g
Magnesium
Magnesium
Calcium
Calcium
Potassium
Potassium
Iron
Iron
Copper
Copper
Zinc
Zinc
Phosphorus
Phosphorus
Sodium
Sodium
Manganese
Manganese
Selenium
Selenium
13%
5.7%
24%
50%
30%
67%
68%
206%
140%
158%
4
100 g
300 g
3 oz - 85g 1 steak (yield from raw steak weighing 550 g) - 380g
Magnesium
Magnesium
Calcium
Calcium
Potassium
Potassium
Iron
Iron
Copper
Copper
Zinc
Zinc
Phosphorus
Phosphorus
Sodium
Sodium
Manganese
Manganese
Selenium
Selenium
14%
4.8%
20%
91%
33%
182%
75%
6.3%
1.3%
148%
Vitamin Comparison
Vitamin comparison score is based on the number of vitamins by which one or the other food is richer. The "coverage" charts below show how much of the daily needs can be covered by 300 grams of the food.
8
100 g
300 g
1 piece - 2g 1 oz - 28g 3 oz - 85g
Vitamin C
Vit. C
Vitamin D
Vit. D
Vitamin A
Vit. A
Vitamin E
Vit. E
Vitamin B1
Vit. B1
Vitamin B2
Vit. B2
Vitamin B3
Vit. B3
Vitamin B5
Vit. B5
Vitamin B6
Vit. B6
Vitamin B12
Vit. B12
Vitamin K
Vit. K
Folate
Folate
0%
20%
0%
21%
68%
59%
94%
56%
84%
163%
15%
3.8%
2
100 g
300 g
3 oz - 85g 1 steak (yield from raw steak weighing 550 g) - 380g
Vitamin C
Vit. C
Vitamin D
Vit. D
Vitamin A
Vit. A
Vitamin E
Vit. E
Vitamin B1
Vit. B1
Vitamin B2
Vit. B2
Vitamin B3
Vit. B3
Vitamin B5
Vit. B5
Vitamin B6
Vit. B6
Vitamin B12
Vit. B12
Vitamin K
Vit. K
Folate
Folate
0%
0%
0%
10%
15%
39%
77%
34%
65%
265%
4.5%
6.8%
All nutrients comparison - raw data values
Nutrient
DV% diff.
Sodium
1582mg
48mg
67%
Saturated fat
17.708g
7.305g
47%
Manganese
1.074mg
0.01mg
46%
Fats
46.28g
18.42g
43%
Zinc
2.44mg
6.69mg
39%
Vitamin B12
1.3µg
2.12µg
34%
Monounsaturated fat
20.77g
7.934g
32%
Polyunsaturated fat
4.458g
0.681g
25%
Protein
19.25g
28.82g
19%
Vitamin B1
0.271mg
0.059mg
18%
Iron
1.33mg
2.43mg
14%
Calories
504kcal
289kcal
11%
Choline
51.2mg
109.8mg
11%
Vitamin D*
52 IU
7%
Vitamin D
1.3µg
7%
Vitamin B2
0.257mg
0.171mg
7%
Vitamin B5
0.93mg
0.568mg
7%
Vitamin B3
4.987mg
4.087mg
6%
Vitamin B6
0.362mg
0.282mg
6%
Cholesterol
97mg
106mg
3%
Vitamin E
1.03mg
0.51mg
3%
Selenium
29µg
27.1µg
3%
Vitamin K
5.8µg
1.8µg
3%
Phosphorus
158mg
175mg
2%
Potassium
274mg
232mg
1%
Copper
0.091mg
0.1mg
1%
Folate
5µg
9µg
1%
Protein per 100 calories
3.8g
10g
N/A
Calories per 10 g protein
262kcal
100kcal
N/A
Weight per 100 calories
20g
35g
N/A
Unsaturated / Saturated Fat ratio
1.4
1.2
N/A
Net carbs
1.18g
0g
N/A
Carbs
1.18g
0g
0%
Magnesium
18mg
19mg
0%
Calcium
19mg
16mg
0%
Trans fat
1.527g
N/A
Tryptophan
0.23mg
0.181mg
0%
Threonine
0.869mg
1.101mg
0%
Isoleucine
0.901mg
1.253mg
0%
Leucine
1.575mg
2.192mg
0%
Lysine
1.652mg
2.328mg
0%
Methionine
0.511mg
0.717mg
0%
Phenylalanine
0.778mg
1.088mg
0%
Valine
0.987mg
1.367mg
0%
Histidine
0.688mg
0.879mg
0%
Omega-3 - EPA
0.004g
0g
N/A
Omega-3 - DHA
0.004g
0g
N/A
Omega-3 - ALA
0.164g
N/A
Omega-3 - DPA
0.02g
0g
N/A
Omega-3 - Eicosatrienoic acid
0.018g
N/A
Omega-6 - Gamma-linoleic acid
0.002g
N/A
Omega-6 - Dihomo-gamma-linoleic acid
0.04g
N/A
Omega-6 - Eicosadienoic acid
0.136g
N/A
Omega-6 - Linoleic acid
3.605g
N/A
Macronutrient Comparison
Macronutrient breakdown side-by-side comparison
3
19%
46%
29%
5%
Protein:
19.25 g
Fats:
46.28 g
Carbs:
1.18 g
Water:
28.55 g
Other:
4.74 g
2
29%
18%
52%
Protein:
28.82 g
Fats:
18.42 g
Carbs:
0 g
Water:
52.48 g
Other:
0.28 g
Contains
more
Fats Fats
+151.2%
Contains
more
Carbs Carbs
+∞%
Contains
more
Other Other
+1592.9%
Contains
more
Protein Protein
+49.7%
Contains
more
Water Water
+83.8%
Fat Type Comparison
Fat type breakdown side-by-side comparison
2
41%
48%
10%
Saturated fat:
Sat. Fat
17.708 g
Monounsaturated fat:
Mono. Fat
20.77 g
Polyunsaturated fat:
Poly. Fat
4.458 g
1
46%
50%
4%
Saturated fat:
Sat. Fat
7.305 g
Monounsaturated fat:
Mono. Fat
7.934 g
Polyunsaturated fat:
Poly. Fat
0.681 g
Contains
more
Mono. Fat Monounsaturated fat
+161.8%
Contains
more
Poly. Fat Polyunsaturated fat
+554.6%
Contains
less
Sat. Fat Saturated fat
-58.7%