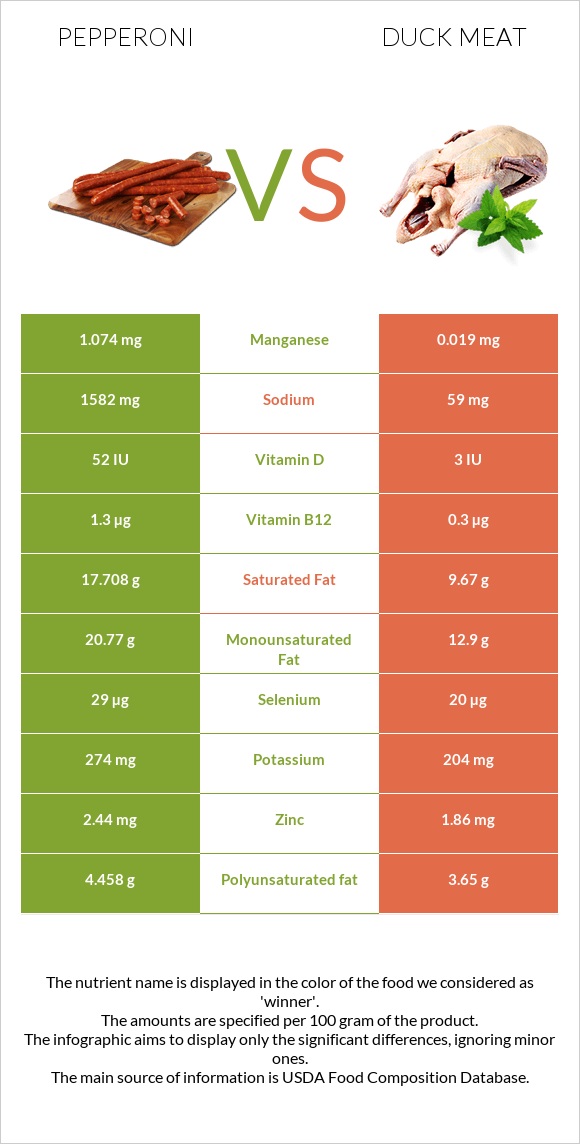
What are the differences between pepperoni and duck meat? Pepperoni is higher in manganese, vitamin B12, selenium, vitamin B6, vitamin B1, and vitamin D*, yet duck meat is higher in iron and copper. Pepperoni's daily need coverage for sodium is 66% more. Pepperoni has 57 times more manganese than duck meat. While pepperoni has 1.074mg of manganese, duck meat has only 0.019mg. The amount of sodium in duck meat is lower. The glycemic index of duck meat is lower. We used Pepperoni, beef, and pork, sliced and Duck, domesticated, meat, and skin, cooked, roasted types in this article.
Infographic
Mineral Comparison
Mineral comparison score is based on the number of minerals by which one or the other food is richer. The "coverage" charts below show how much of the daily needs can be covered by 300 grams of the food.
6
100 g
300 g
1 piece - 2g 1 oz - 28g 3 oz - 85g
Magnesium
Magnesium
Calcium
Calcium
Potassium
Potassium
Iron
Iron
Copper
Copper
Zinc
Zinc
Phosphorus
Phosphorus
Sodium
Sodium
Manganese
Manganese
Selenium
Selenium
13%
5.7%
24%
50%
30%
67%
68%
206%
140%
158%
3
100 g
300 g
1 cup, chopped or diced - 140g 1 unit (yield from 1 lb ready-to-cook duck) - 173g 0.5 duck - 382g
Magnesium
Magnesium
Calcium
Calcium
Potassium
Potassium
Iron
Iron
Copper
Copper
Zinc
Zinc
Phosphorus
Phosphorus
Sodium
Sodium
Manganese
Manganese
Selenium
Selenium
11%
3.3%
18%
101%
76%
51%
67%
7.7%
2.5%
109%
Vitamin Comparison
Vitamin comparison score is based on the number of vitamins by which one or the other food is richer. The "coverage" charts below show how much of the daily needs can be covered by 300 grams of the food.
6
100 g
300 g
1 piece - 2g 1 oz - 28g 3 oz - 85g
Vitamin C
Vit. C
Vitamin D
Vit. D
Vitamin A
Vit. A
Vitamin E
Vit. E
Vitamin B1
Vit. B1
Vitamin B2
Vit. B2
Vitamin B3
Vit. B3
Vitamin B5
Vit. B5
Vitamin B6
Vit. B6
Vitamin B12
Vit. B12
Vitamin K
Vit. K
Folate
Folate
0%
20%
0%
21%
68%
59%
94%
56%
84%
163%
15%
3.8%
3
100 g
300 g
1 cup, chopped or diced - 140g 1 unit (yield from 1 lb ready-to-cook duck) - 173g 0.5 duck - 382g
Vitamin C
Vit. C
Vitamin D
Vit. D
Vitamin A
Vit. A
Vitamin E
Vit. E
Vitamin B1
Vit. B1
Vitamin B2
Vit. B2
Vitamin B3
Vit. B3
Vitamin B5
Vit. B5
Vitamin B6
Vit. B6
Vitamin B12
Vit. B12
Vitamin K
Vit. K
Folate
Folate
0%
1.5%
21%
14%
44%
62%
90%
66%
42%
38%
13%
4.5%
All nutrients comparison - raw data values
Nutrient
DV% diff.
Sodium
1582mg
59mg
66%
Manganese
1.074mg
0.019mg
46%
Vitamin B12
1.3µg
0.3µg
42%
Saturated fat
17.708g
9.67g
37%
Fats
46.28g
28.35g
28%
Monounsaturated fat
20.77g
12.9g
20%
Iron
1.33mg
2.7mg
17%
Selenium
29µg
20µg
16%
Copper
0.091mg
0.227mg
15%
Vitamin B6
0.362mg
0.18mg
14%
Calories
504kcal
337kcal
8%
Vitamin B1
0.271mg
0.174mg
8%
Vitamin A
0µg
63µg
7%
Vitamin D*
52 IU
3 IU
6%
Vitamin D
1.3µg
0.1µg
6%
Zinc
2.44mg
1.86mg
5%
Polyunsaturated fat
4.458g
3.65g
5%
Cholesterol
97mg
84mg
4%
Vitamin B5
0.93mg
1.098mg
3%
Potassium
274mg
204mg
2%
Vitamin E
1.03mg
0.7mg
2%
Protein
19.25g
18.99g
1%
Calcium
19mg
11mg
1%
Vitamin B2
0.257mg
0.269mg
1%
Vitamin B3
4.987mg
4.825mg
1%
Vitamin K
5.8µg
5.1µg
1%
Protein per 100 calories
3.8g
5.6g
N/A
Calories per 10 g protein
262kcal
177kcal
N/A
Weight per 100 calories
20g
30g
N/A
Unsaturated / Saturated Fat ratio
1.4
1.7
N/A
Net carbs
1.18g
0g
N/A
Carbs
1.18g
0g
0%
Magnesium
18mg
16mg
0%
Phosphorus
158mg
156mg
0%
Folate
5µg
6µg
0%
Trans fat
1.527g
N/A
Choline
51.2mg
50.4mg
0%
Tryptophan
0.23mg
0.232mg
0%
Threonine
0.869mg
0.773mg
0%
Isoleucine
0.901mg
0.872mg
0%
Leucine
1.575mg
1.465mg
0%
Lysine
1.652mg
1.486mg
0%
Methionine
0.511mg
0.475mg
0%
Phenylalanine
0.778mg
0.752mg
0%
Valine
0.987mg
0.938mg
0%
Histidine
0.688mg
0.462mg
0%
Omega-3 - EPA
0.004g
0g
N/A
Omega-3 - DHA
0.004g
0g
N/A
Omega-3 - ALA
0.164g
N/A
Omega-3 - DPA
0.02g
0g
N/A
Omega-3 - Eicosatrienoic acid
0.018g
N/A
Omega-6 - Gamma-linoleic acid
0.002g
N/A
Omega-6 - Dihomo-gamma-linoleic acid
0.04g
N/A
Omega-6 - Eicosadienoic acid
0.136g
N/A
Omega-6 - Linoleic acid
3.605g
N/A
Macronutrient Comparison
Macronutrient breakdown side-by-side comparison
4
19%
46%
29%
5%
Protein:
19.25 g
Fats:
46.28 g
Carbs:
1.18 g
Water:
28.55 g
Other:
4.74 g
1
19%
28%
52%
Protein:
18.99 g
Fats:
28.35 g
Carbs:
0 g
Water:
51.84 g
Other:
0.82 g
Contains
more
Fats Fats
+63.2%
Contains
more
Carbs Carbs
+∞%
Contains
more
Other Other
+478%
Contains
more
Water Water
+81.6%
~equal in
Protein
~18.99g
Fat Type Comparison
Fat type breakdown side-by-side comparison
2
41%
48%
10%
Saturated fat:
Sat. Fat
17.708 g
Monounsaturated fat:
Mono. Fat
20.77 g
Polyunsaturated fat:
Poly. Fat
4.458 g
1
37%
49%
14%
Saturated fat:
Sat. Fat
9.67 g
Monounsaturated fat:
Mono. Fat
12.9 g
Polyunsaturated fat:
Poly. Fat
3.65 g
Contains
more
Mono. Fat Monounsaturated fat
+61%
Contains
more
Poly. Fat Polyunsaturated fat
+22.1%
Contains
less
Sat. Fat Saturated fat
-45.4%