Persimmon vs. Yogurt — In-Depth Nutrition Comparison
Compare
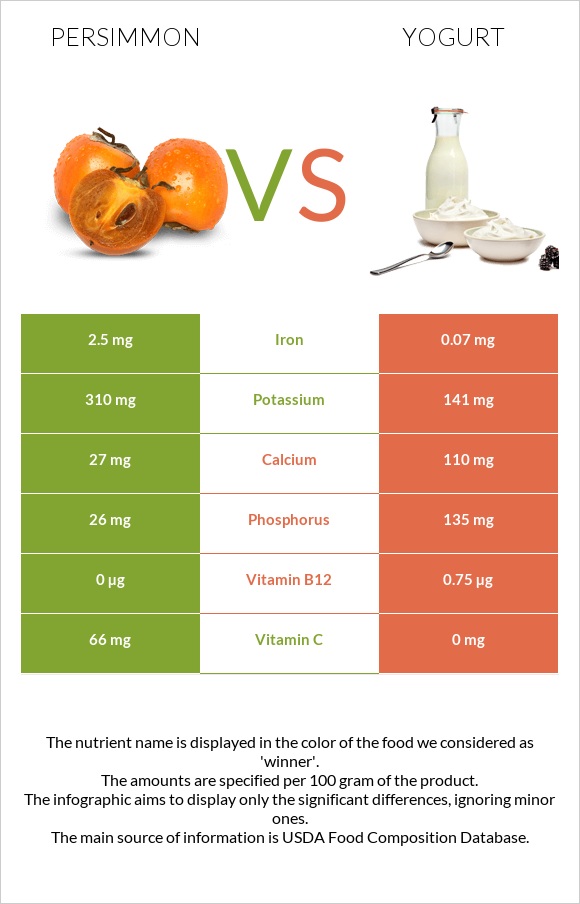
Differences between persimmon and yogurt
- Persimmon has more vitamin C and iron, while yogurt has more vitamin B12, phosphorus, and calcium.
- Persimmon's daily need coverage for vitamin C is 73% higher.
- Yogurt contains 36 times less iron than persimmon. Persimmon contains 2.5mg of iron, while yogurt contains 0.07mg.
- Yogurt has a lower glycemic index. The glycemic index of yogurt is 19, while the glycemic index of persimmon is 61.
The food types used in this comparison are Persimmons, native, raw and Yogurt, Greek, plain, nonfat.
Infographic
Infographic link
Mineral Comparison
Mineral comparison score is based on the number of minerals by which one or the other food is richer. The "coverage" charts below show how much of the daily needs can be covered by 300 grams of the food.
| Contains more PotassiumPotassium | +119.9% |
| Contains more IronIron | +3471.4% |
| Contains less SodiumSodium | -97.2% |
| Contains more CalciumCalcium | +307.4% |
| Contains more PhosphorusPhosphorus | +419.2% |
Vitamin Comparison
Vitamin comparison score is based on the number of vitamins by which one or the other food is richer. The "coverage" charts below show how much of the daily needs can be covered by 300 grams of the food.
| Contains more Vitamin CVitamin C | +∞% |
| Contains more Vitamin B12Vitamin B12 | +∞% |
All nutrients comparison - raw data values
| Nutrient |  |
 |
DV% diff. |
| Vitamin C | 66mg | 0mg | 73% |
| Vitamin B12 | 0µg | 0.75µg | 31% |
| Iron | 2.5mg | 0.07mg | 30% |
| Vitamin B2 | 0.278mg | 21% | |
| Protein | 0.8g | 10.19g | 19% |
| Selenium | 9.7µg | 18% | |
| Phosphorus | 26mg | 135mg | 16% |
| Carbs | 33.5g | 3.6g | 10% |
| Calcium | 27mg | 110mg | 8% |
| Vitamin B5 | 0.331mg | 7% | |
| Potassium | 310mg | 141mg | 5% |
| Zinc | 0.52mg | 5% | |
| Vitamin B6 | 0.063mg | 5% | |
| Calories | 127kcal | 59kcal | 3% |
| Magnesium | 11mg | 3% | |
| Choline | 15.1mg | 3% | |
| Cholesterol | 0mg | 5mg | 2% |
| Copper | 0.017mg | 2% | |
| Sodium | 1mg | 36mg | 2% |
| Vitamin B1 | 0.023mg | 2% | |
| Folate | 7µg | 2% | |
| Vitamin B3 | 0.208mg | 1% | |
| Saturated fat | 0.117g | 1% | |
| Fats | 0.4g | 0.39g | 0% |
| Net carbs | 33.5g | 3.6g | N/A |
| Sugar | 3.24g | N/A | |
| Vitamin A | 1µg | 0% | |
| Vitamin E | 0.01mg | 0% | |
| Manganese | 0.009mg | 0% | |
| Trans fat | 0g | 0.006g | N/A |
| Monounsaturated fat | 0.053g | 0% | |
| Polyunsaturated fat | 0.012g | 0% | |
| Tryptophan | 0.014mg | 0% | |
| Threonine | 0.041mg | 0% | |
| Isoleucine | 0.035mg | 0% | |
| Leucine | 0.058mg | 0% | |
| Lysine | 0.045mg | 0% | |
| Methionine | 0.007mg | 0% | |
| Phenylalanine | 0.036mg | 0% | |
| Valine | 0.042mg | 0% | |
| Histidine | 0.016mg | 0% | |
| Omega-3 - ALA | 0.001g | N/A | |
| Omega-6 - Linoleic acid | 0.01g | N/A |
Macronutrient Comparison
Macronutrient breakdown side-by-side comparison
| Contains more CarbsCarbs | +830.6% |
| Contains more OtherOther | +25% |
| Contains more ProteinProtein | +1173.8% |
| Contains more WaterWater | +32.1% |
~equal in
Fats
~0.39g


