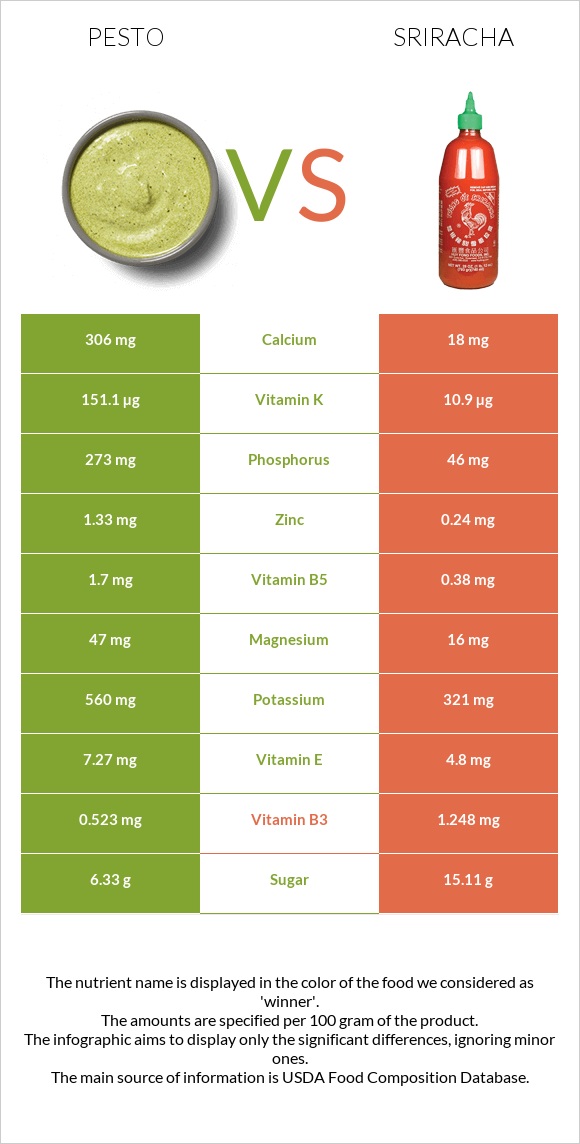
What are the differences between pesto and sriracha? Pesto is higher in vitamin K, vitamin B2, phosphorus, calcium, vitamin B5, and manganese, yet sriracha is higher in vitamin C, vitamin B6, and vitamin A. Pesto's daily need coverage for vitamin K is 117% more. Pesto has 17 times more calcium than sriracha. While pesto has 306mg of calcium, sriracha has only 18mg. The amount of sodium in pesto is lower. We used Sauce, pesto, ready-to-serve, refrigerated and Sauce, hot chile, sriracha types in this article.
Infographic
Mineral Comparison
Mineral comparison score is based on the number of minerals by which one or the other food is richer. The "coverage" charts below show how much of the daily needs can be covered by 300 grams of the food.
8
100 g
300 g
0.25 cup - 63g
Magnesium
Magnesium
Calcium
Calcium
Potassium
Potassium
Iron
Iron
Copper
Copper
Zinc
Zinc
Phosphorus
Phosphorus
Sodium
Sodium
Manganese
Manganese
Selenium
Selenium
34%
92%
49%
21%
27%
36%
117%
79%
76%
0%
2
100 g
300 g
1 tsp - 6.5g
Magnesium
Magnesium
Calcium
Calcium
Potassium
Potassium
Iron
Iron
Copper
Copper
Zinc
Zinc
Phosphorus
Phosphorus
Sodium
Sodium
Manganese
Manganese
Selenium
Selenium
11%
5.4%
28%
62%
20%
6.5%
20%
277%
19%
2.2%
Vitamin Comparison
Vitamin comparison score is based on the number of vitamins by which one or the other food is richer. The "coverage" charts below show how much of the daily needs can be covered by 300 grams of the food.
5
100 g
300 g
0.25 cup - 63g
Vitamin C
Vit. C
Vitamin D
Vit. D
Vitamin A
Vit. A
Vitamin E
Vit. E
Vitamin B1
Vit. B1
Vitamin B2
Vit. B2
Vitamin B3
Vit. B3
Vitamin B5
Vit. B5
Vitamin B6
Vit. B6
Vitamin B12
Vit. B12
Vitamin K
Vit. K
Folate
Folate
0%
0%
26%
145%
43%
165%
9.8%
102%
31%
0%
378%
12%
5
100 g
300 g
1 tsp - 6.5g
Vitamin C
Vit. C
Vitamin D
Vit. D
Vitamin A
Vit. A
Vitamin E
Vit. E
Vitamin B1
Vit. B1
Vitamin B2
Vit. B2
Vitamin B3
Vit. B3
Vitamin B5
Vit. B5
Vitamin B6
Vit. B6
Vitamin B12
Vit. B12
Vitamin K
Vit. K
Folate
Folate
90%
0%
43%
96%
19%
51%
23%
23%
105%
0%
27%
17%
All nutrients comparison - raw data values
Nutrient
DV% diff.
Vitamin K
151.1µg
10.9µg
117%
Sodium
603mg
2124mg
66%
Fats
37.6g
0.93g
56%
Monounsaturated fat
22.155g
55%
Polyunsaturated fat
6.546g
44%
Vitamin B2
0.717mg
0.222mg
38%
Phosphorus
273mg
46mg
32%
Saturated fat
7.07g
32%
Vitamin C
0mg
26.9mg
30%
Calcium
306mg
18mg
29%
Vitamin B5
1.7mg
0.38mg
26%
Vitamin B6
0.133mg
0.455mg
25%
Manganese
0.586mg
0.146mg
19%
Calories
418kcal
93kcal
16%
Protein
9.83g
1.93g
16%
Vitamin E
7.27mg
4.8mg
16%
Iron
0.57mg
1.64mg
13%
Zinc
1.33mg
0.24mg
10%
Fructose
0g
8.16g
10%
Vitamin B1
0.17mg
0.077mg
8%
Magnesium
47mg
16mg
7%
Potassium
560mg
321mg
7%
Vitamin A
77µg
129µg
6%
Vitamin B3
0.523mg
1.248mg
5%
Carbs
10.09g
19.16g
3%
Fiber
1.8g
2.2g
2%
Copper
0.08mg
0.06mg
2%
Folate
16µg
22µg
2%
Starch
2.2g
1%
Selenium
0.4µg
1%
Protein per 100 calories
2.4g
2.1g
N/A
Calories per 10 g protein
425kcal
482kcal
N/A
Weight per 100 calories
24g
108g
N/A
Unsaturated / Saturated Fat ratio
4.1
N/A
Net carbs
8.29g
16.96g
N/A
Sugar
6.33g
15.11g
N/A
Trans fat
0.398g
N/A
Omega-3 - EPA
0.002g
N/A
Omega-3 - ALA
1.268g
N/A
Omega-3 - DPA
0.004g
N/A
Omega-3 - Eicosatrienoic acid
0.002g
N/A
Omega-6 - Gamma-linoleic acid
0.058g
N/A
Omega-6 - Dihomo-gamma-linoleic acid
0.007g
N/A
Omega-6 - Eicosadienoic acid
0.021g
N/A
Omega-6 - Linoleic acid
4.783g
N/A
Macronutrient Comparison
Macronutrient breakdown side-by-side comparison
2
10%
38%
10%
39%
4%
Protein:
9.83 g
Fats:
37.6 g
Carbs:
10.09 g
Water:
38.98 g
Other:
3.5 g
3
2%
19%
72%
6%
Protein:
1.93 g
Fats:
0.93 g
Carbs:
19.16 g
Water:
71.84 g
Other:
6.14 g
Contains
more
Protein Protein
+409.3%
Contains
more
Fats Fats
+3943%
Contains
more
Carbs Carbs
+89.9%
Contains
more
Water Water
+84.3%
Contains
more
Other Other
+75.4%
Carbohydrate type comparison
Carbohydrate type breakdown side-by-side comparison
3
26%
3%
70%
2%
Starch:
2.2 g
Sucrose:
0 g
Glucose:
0.23 g
Fructose:
0 g
Lactose:
5.94 g
Maltose:
0 g
Galactose:
0.15 g
3
2%
44%
54%
Starch:
0 g
Sucrose:
0.27 g
Glucose:
6.67 g
Fructose:
8.16 g
Lactose:
0 g
Maltose:
0 g
Galactose:
0 g
Contains
more
Starch Starch
+∞%
Contains
more
Lactose Lactose
+∞%
Contains
more
Galactose Galactose
+∞%
Contains
more
Sucrose Sucrose
+∞%
Contains
more
Glucose Glucose
+2800%
Contains
more
Fructose Fructose
+∞%