Pico de gallo vs. Chinese fried rice — In-Depth Nutrition Comparison
Compare
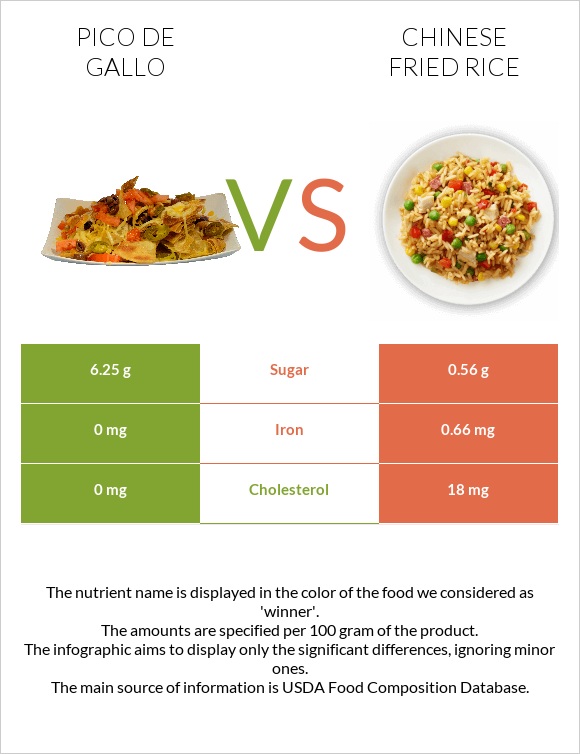
How are pico de gallo and Chinese fried rice different?
- Chinese fried rice has more iron than pico de gallo.
- Pico de gallo contains 11 times more sugar than Chinese fried rice. While pico de gallo contains 6.25g of sugar, Chinese fried rice contains only 0.56g.
PACE, Pico De Gallo and Restaurant, Chinese, fried rice, without meat are the varieties used in this article.
Infographic
Infographic link
Mineral Comparison
Mineral comparison score is based on the number of minerals by which one or the other food is richer. The "coverage" charts below show how much of the daily needs can be covered by 300 grams of the food.
| Contains more CalciumCalcium | +∞% |
| Contains more IronIron | +∞% |
| Contains less SodiumSodium | -17.5% |
Vitamin Comparison
Vitamin comparison score is based on the number of vitamins by which one or the other food is richer. The "coverage" charts below show how much of the daily needs can be covered by 300 grams of the food.
All nutrients comparison - raw data values
| Nutrient |  |
 |
DV% diff. |
| Manganese | 0.433mg | 19% | |
| Selenium | 8.3µg | 15% | |
| Starch | 30.8g | 13% | |
| Copper | 0.095mg | 11% | |
| Protein | 0g | 4.05g | 8% |
| Carbs | 9.38g | 32.79g | 8% |
| Iron | 0mg | 0.66mg | 8% |
| Calories | 31kcal | 174kcal | 7% |
| Zinc | 0.72mg | 7% | |
| Phosphorus | 51mg | 7% | |
| Polyunsaturated fat | 1.111g | 7% | |
| Cholesterol | 0mg | 18mg | 6% |
| Fats | 0g | 2.96g | 5% |
| Fiber | 1.1g | 4% | |
| Sodium | 469mg | 387mg | 4% |
| Vitamin B3 | 0.637mg | 4% | |
| Magnesium | 10mg | 2% | |
| Potassium | 76mg | 2% | |
| Vitamin A | 22µg | 2% | |
| Vitamin B2 | 0.026mg | 2% | |
| Vitamin B6 | 0.032mg | 2% | |
| Vitamin K | 2.8µg | 2% | |
| Folate | 6µg | 2% | |
| Saturated fat | 0g | 0.54g | 2% |
| Monounsaturated fat | 0.649g | 2% | |
| Calcium | 0mg | 12mg | 1% |
| Vitamin E | 0.13mg | 1% | |
| Vitamin B1 | 0.015mg | 1% | |
| Choline | 5.5mg | 1% | |
| Vitamin C | 3.8mg | 3.8mg | 0% |
| Net carbs | 9.38g | 31.69g | N/A |
| Sugar | 6.25g | 0.56g | N/A |
| Trans fat | 0.011g | N/A | |
| Tryptophan | 0.052mg | 0% | |
| Threonine | 0.173mg | 0% | |
| Isoleucine | 0.173mg | 0% | |
| Leucine | 0.335mg | 0% | |
| Lysine | 0.173mg | 0% | |
| Methionine | 0.114mg | 0% | |
| Phenylalanine | 0.225mg | 0% | |
| Valine | 0.251mg | 0% | |
| Histidine | 0.094mg | 0% | |
| Fructose | 0.05g | 0% | |
| Omega-3 - DHA | 0.002g | N/A | |
| Omega-3 - ALA | 0.111g | N/A | |
| Omega-6 - Gamma-linoleic acid | 0.002g | N/A | |
| Omega-6 - Eicosadienoic acid | 0.001g | N/A | |
| Omega-6 - Linoleic acid | 0.981g | N/A |
Macronutrient Comparison
Macronutrient breakdown side-by-side comparison
Protein:
0 g
Fats:
0 g
Carbs:
9.38 g
Water:
88 g
Other:
2.62 g
Protein:
4.05 g
Fats:
2.96 g
Carbs:
32.79 g
Water:
59.09 g
Other:
1.11 g
| Contains more WaterWater | +48.9% |
| Contains more OtherOther | +136% |
| Contains more ProteinProtein | +∞% |
| Contains more FatsFats | +∞% |
| Contains more CarbsCarbs | +249.6% |


