Pineapple juice vs. Sour cherry — In-Depth Nutrition Comparison
Compare
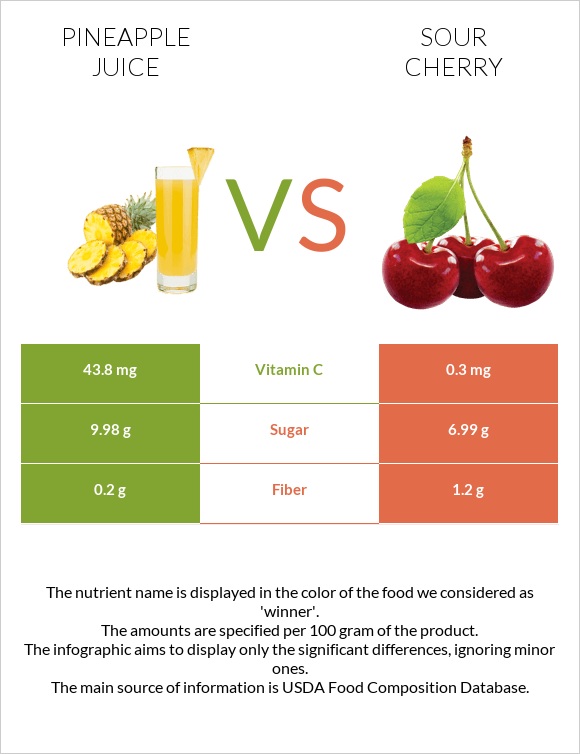
Differences between pineapple juice and sour cherries
- Pineapple juice has more vitamin C and manganese, while sour cherries have more vitamin K.
- Pineapple juice's daily need coverage for vitamin C is 48% higher.
- Sour cherries contain 9 times less manganese than pineapple juice. Pineapple juice contains 0.504mg of manganese, while sour cherries contain 0.059mg.
- The amount of sugar in sour cherries is lower.
The food types used in this comparison are Pineapple juice, canned or bottled, unsweetened, with added ascorbic acid and Cherries, sour, canned, water pack, drained.
Infographic
Infographic link
Mineral Comparison
Mineral comparison score is based on the number of minerals by which one or the other food is richer. The "coverage" charts below show how much of the daily needs can be covered by 300 grams of the food.
| Contains more MagnesiumMagnesium | +50% |
| Contains more CalciumCalcium | +18.2% |
| Contains more PotassiumPotassium | +13% |
| Contains more CopperCopper | +∞% |
| Contains more ZincZinc | +57.1% |
| Contains less SodiumSodium | -50% |
| Contains more ManganeseManganese | +754.2% |
| Contains more SeleniumSelenium | +∞% |
| Contains more IronIron | +106.5% |
| Contains more PhosphorusPhosphorus | +100% |
Vitamin Comparison
Vitamin comparison score is based on the number of vitamins by which one or the other food is richer. The "coverage" charts below show how much of the daily needs can be covered by 300 grams of the food.
| Contains more Vitamin CVitamin C | +14500% |
| Contains more Vitamin EVitamin E | +∞% |
| Contains more Vitamin B1Vitamin B1 | +132% |
| Contains more Vitamin B5Vitamin B5 | +36.6% |
| Contains more Vitamin B6Vitamin B6 | +112.8% |
| Contains more FolateFolate | +∞% |
| Contains more CholineCholine | +∞% |
| Contains more Vitamin B2Vitamin B2 | +209.5% |
| Contains more Vitamin B3Vitamin B3 | +30.7% |
| Contains more Vitamin KVitamin K | +2600% |
All nutrients comparison - raw data values
| Nutrient |  |
 |
DV% diff. |
| Vitamin C | 43.8mg | 0.3mg | 48% |
| Manganese | 0.504mg | 0.059mg | 19% |
| Copper | 0.069mg | 8% | |
| Vitamin K | 0.3µg | 8.1µg | 7% |
| Folate | 18µg | 5% | |
| Vitamin B6 | 0.1mg | 0.047mg | 4% |
| Iron | 0.31mg | 0.64mg | 4% |
| Fiber | 0.2g | 1.2g | 4% |
| Vitamin B2 | 0.021mg | 0.065mg | 3% |
| Vitamin B1 | 0.058mg | 0.025mg | 3% |
| Calories | 53kcal | 42kcal | 1% |
| Protein | 0.36g | 0.69g | 1% |
| Choline | 3.3mg | 1% | |
| Fructose | 3.81g | 2.79g | 1% |
| Phosphorus | 8mg | 16mg | 1% |
| Magnesium | 12mg | 8mg | 1% |
| Carbs | 12.87g | 10.45g | 1% |
| Fats | 0.12g | 0.21g | 0% |
| Net carbs | 12.67g | 9.25g | N/A |
| Calcium | 13mg | 11mg | 0% |
| Potassium | 130mg | 115mg | 0% |
| Sugar | 9.98g | 6.99g | N/A |
| Zinc | 0.11mg | 0.07mg | 0% |
| Sodium | 2mg | 4mg | 0% |
| Vitamin E | 0.02mg | 0% | |
| Selenium | 0.1µg | 0% | |
| Vitamin B3 | 0.199mg | 0.26mg | 0% |
| Vitamin B5 | 0.056mg | 0.041mg | 0% |
| Saturated fat | 0.008g | 0% | |
| Monounsaturated fat | 0.014g | 0% | |
| Polyunsaturated fat | 0.042g | 0% |
Macronutrient Comparison
Macronutrient breakdown side-by-side comparison
Protein:
0.36 g
Fats:
0.12 g
Carbs:
12.87 g
Water:
86.37 g
Other:
0.28 g
Protein:
0.69 g
Fats:
0.21 g
Carbs:
10.45 g
Water:
88.31 g
Other:
0.34 g
| Contains more CarbsCarbs | +23.2% |
| Contains more ProteinProtein | +91.7% |
| Contains more FatsFats | +75% |
| Contains more OtherOther | +21.4% |
~equal in
Water
~88.31g
Carbohydrate type comparison
Carbohydrate type breakdown side-by-side comparison
Starch:
0 g
Sucrose:
1.53 g
Glucose:
4.65 g
Fructose:
3.81 g
Lactose:
0 g
Maltose:
0 g
Galactose:
0 g
Starch:
0 g
Sucrose:
0.01 g
Glucose:
4.19 g
Fructose:
2.79 g
Lactose:
0 g
Maltose:
0 g
Galactose:
0 g
| Contains more SucroseSucrose | +15200% |
| Contains more FructoseFructose | +36.6% |
~equal in
Starch
~0g
~equal in
Glucose
~4.19g
~equal in
Lactose
~0g
~equal in
Maltose
~0g
~equal in
Galactose
~0g


