Differences between popcorn and chickpeas Popcorn has more fiber, phosphorus, magnesium, zinc, and vitamin B3, while chickpeas have more folate, copper, and selenium. Chickpeas' daily need coverage for folate is 35% higher. Chickpeas contain 4 times less vitamin B3 than popcorn. Popcorn contains 2.308mg of vitamin B3, while chickpeas contain 0.526mg. Chickpeas have a lower glycemic index. The glycemic index of chickpeas is 36, while the glycemic index of popcorn is 62. The food types used in this comparison are Snacks, popcorn, air-popped and Chickpeas (garbanzo beans, bengal gram), mature seeds, cooked, boiled, without salt .
Infographic
Mineral Comparison
Mineral comparison score is based on the number of minerals by which one or the other food is richer. The "coverage" charts below show how much of the daily needs can be covered by 300 grams of the food.
4
100 g
300 g
1 cup - 8g 1 oz - 28.35g
Magnesium
Magnesium
Calcium
Calcium
Potassium
Potassium
Iron
Iron
Copper
Copper
Zinc
Zinc
Phosphorus
Phosphorus
Sodium
Sodium
Manganese
Manganese
Selenium
Selenium
103%
2.1%
29%
120%
87%
84%
153%
1%
145%
0%
4
100 g
300 g
1 cup - 164g
Magnesium
Magnesium
Calcium
Calcium
Potassium
Potassium
Iron
Iron
Copper
Copper
Zinc
Zinc
Phosphorus
Phosphorus
Sodium
Sodium
Manganese
Manganese
Selenium
Selenium
34%
15%
26%
108%
117%
42%
72%
0.91%
134%
20%
Vitamin Comparison
Vitamin comparison score is based on the number of vitamins by which one or the other food is richer. The "coverage" charts below show how much of the daily needs can be covered by 300 grams of the food.
5
100 g
300 g
1 cup - 8g 1 oz - 28.35g
Vitamin C
Vit. C
Vitamin D
Vit. D
Vitamin A
Vit. A
Vitamin E
Vit. E
Vitamin B1
Vit. B1
Vitamin B2
Vit. B2
Vitamin B3
Vit. B3
Vitamin B5
Vit. B5
Vitamin B6
Vit. B6
Vitamin B12
Vit. B12
Vitamin K
Vit. K
Folate
Folate
0%
0%
3.3%
5.8%
26%
19%
43%
31%
36%
0%
3%
23%
5
100 g
300 g
1 cup - 164g
Vitamin C
Vit. C
Vitamin D
Vit. D
Vitamin A
Vit. A
Vitamin E
Vit. E
Vitamin B1
Vit. B1
Vitamin B2
Vit. B2
Vitamin B3
Vit. B3
Vitamin B5
Vit. B5
Vitamin B6
Vit. B6
Vitamin B12
Vit. B12
Vitamin K
Vit. K
Folate
Folate
4.3%
0%
0.33%
7%
29%
15%
9.9%
17%
32%
0%
10%
129%
All nutrients comparison - raw data values
Nutrient
DV% diff.
Folate
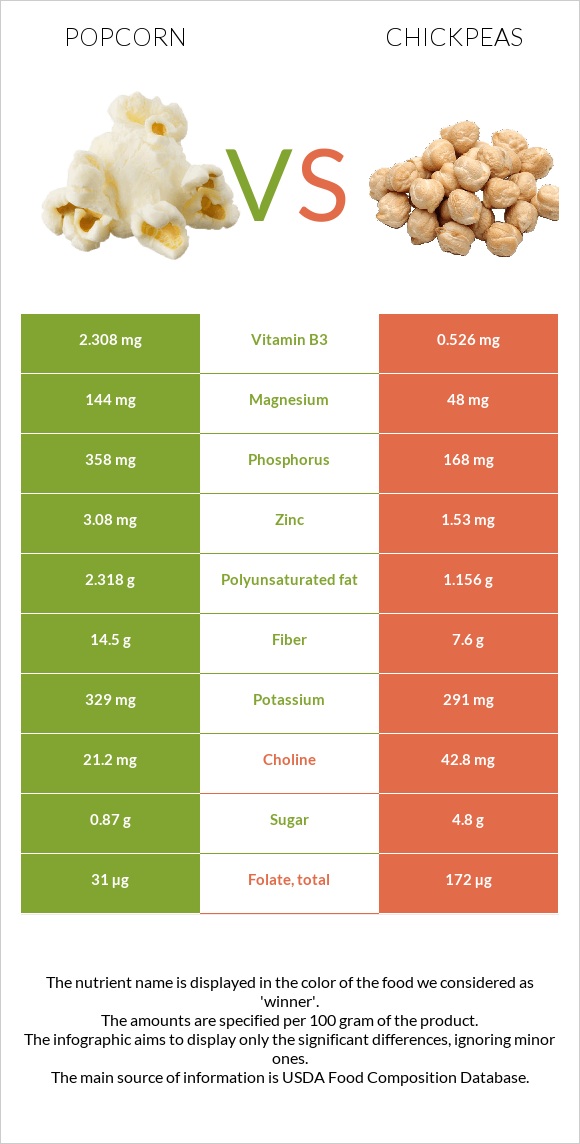
31µg
172µg
35%
Fiber
14.5g
7.6g
28%
Phosphorus
358mg
168mg
27%
Magnesium
144mg
48mg
23%
Starch
54.4g
22%
Carbs
77.78g
27.42g
17%
Zinc
3.08mg
1.53mg
14%
Calories
387kcal
164kcal
11%
Vitamin B3
2.308mg
0.526mg
11%
Copper
0.262mg
0.352mg
10%
Protein
12.94g
8.86g
8%
Polyunsaturated fat
2.318g
1.156g
8%
Selenium
0µg
3.7µg
7%
Calcium
7mg
49mg
4%
Iron
3.19mg
2.89mg
4%
Manganese
1.113mg
1.03mg
4%
Vitamin B5
0.51mg
0.286mg
4%
Choline
21.2mg
42.8mg
4%
Fats
4.54g
2.59g
3%
Vitamin B2
0.083mg
0.063mg
2%
Vitamin K
1.2µg
4µg
2%
Saturated fat
0.637g
0.269g
2%
Vitamin C
0mg
1.3mg
1%
Potassium
329mg
291mg
1%
Vitamin A
10µg
1µg
1%
Vitamin B1
0.104mg
0.116mg
1%
Vitamin B6
0.157mg
0.139mg
1%
Monounsaturated fat
0.95g
0.583g
1%
Protein per 100 calories
3.3g
5.4g
N/A
Calories per 10 g protein
299kcal
185kcal
N/A
Weight per 100 calories
26g
61g
N/A
Unsaturated / Saturated Fat ratio
5.1
6.5
N/A
Net carbs
63.28g
19.82g
N/A
Sugar
0.87g
4.8g
N/A
Sodium
8mg
7mg
0%
Vitamin E
0.29mg
0.35mg
0%
Tryptophan
0.085mg
0.085mg
0%
Threonine
0.452mg
0.329mg
0%
Isoleucine
0.431mg
0.38mg
0%
Leucine
1.473mg
0.631mg
0%
Lysine
0.338mg
0.593mg
0%
Methionine
0.252mg
0.116mg
0%
Phenylalanine
0.59mg
0.475mg
0%
Valine
0.607mg
0.372mg
0%
Histidine
0.367mg
0.244mg
0%
Fructose
0.07g
0%
Macronutrient Comparison
Macronutrient breakdown side-by-side comparison
4
13%
5%
78%
3%
Protein:
12.94 g
Fats:
4.54 g
Carbs:
77.78 g
Water:
3.32 g
Other:
1.42 g
1
9%
3%
27%
60%
Protein:
8.86 g
Fats:
2.59 g
Carbs:
27.42 g
Water:
60.21 g
Other:
0.92 g
Contains
more
Protein Protein
+46%
Contains
more
Fats Fats
+75.3%
Contains
more
Carbs Carbs
+183.7%
Contains
more
Other Other
+54.3%
Contains
more
Water Water
+1713.6%
Fat Type Comparison
Fat type breakdown side-by-side comparison
2
16%
24%
59%
Saturated fat:
Sat. Fat
0.637 g
Monounsaturated fat:
Mono. Fat
0.95 g
Polyunsaturated fat:
Poly. Fat
2.318 g
1
13%
29%
58%
Saturated fat:
Sat. Fat
0.269 g
Monounsaturated fat:
Mono. Fat
0.583 g
Polyunsaturated fat:
Poly. Fat
1.156 g
Contains
more
Mono. Fat Monounsaturated fat
+63%
Contains
more
Poly. Fat Polyunsaturated fat
+100.5%
Contains
less
Sat. Fat Saturated fat
-57.8%