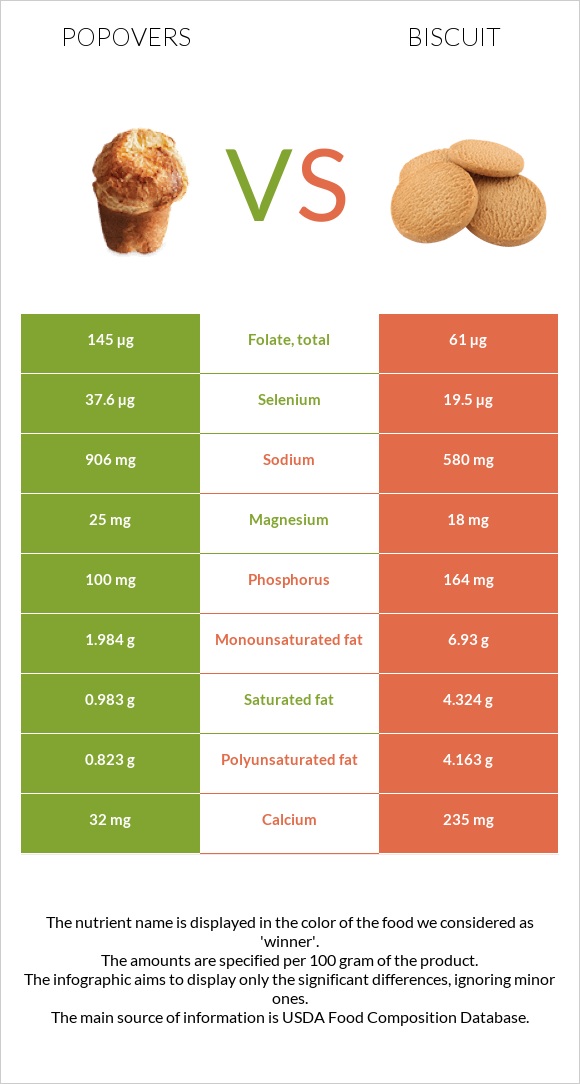
A recap on the differences between popovers and biscuits Popovers are higher in selenium, folate, manganese, copper, and vitamin B1, yet biscuits are higher in calcium, vitamin B2, and phosphorus. Popovers cover your daily selenium needs 33% more than biscuits. Popovers contain 2 times more folate than biscuits. While popovers contain 145µg of folate, biscuits contain only 61µg. The amount of sodium in biscuits is lower. Food varieties used in this article are Popovers, dry mix, enriched and Biscuits, plain or buttermilk, prepared from recipe .
Infographic
Mineral Comparison
Mineral comparison score is based on the number of minerals by which one or the other food is richer. The "coverage" charts below show how much of the daily needs can be covered by 300 grams of the food.
5
100 g
300 g
1 oz - 28.35g 1 package (6 oz) - 170g
Magnesium
Magnesium
Calcium
Calcium
Potassium
Potassium
Iron
Iron
Copper
Copper
Zinc
Zinc
Phosphorus
Phosphorus
Sodium
Sodium
Manganese
Manganese
Selenium
Selenium
18%
9.6%
8.8%
111%
57%
24%
43%
118%
97%
205%
4
100 g
300 g
1 small (1-1/2" dia) - 14g 1 oz - 28.35g 1 biscuit (2-1/2" dia) - 60g 1 biscuit (4" dia) - 101g
Magnesium
Magnesium
Calcium
Calcium
Potassium
Potassium
Iron
Iron
Copper
Copper
Zinc
Zinc
Phosphorus
Phosphorus
Sodium
Sodium
Manganese
Manganese
Selenium
Selenium
13%
71%
11%
109%
27%
15%
70%
76%
49%
106%
Vitamin Comparison
Vitamin comparison score is based on the number of vitamins by which one or the other food is richer. The "coverage" charts below show how much of the daily needs can be covered by 300 grams of the food.
5
100 g
300 g
1 oz - 28.35g 1 package (6 oz) - 170g
Vitamin C
Vit. C
Vitamin D
Vit. D
Vitamin A
Vit. A
Vitamin E
Vit. E
Vitamin B1
Vit. B1
Vitamin B2
Vit. B2
Vitamin B3
Vit. B3
Vitamin B5
Vit. B5
Vitamin B6
Vit. B6
Vitamin B12
Vit. B12
Vitamin K
Vit. K
Folate
Folate
0.33%
0%
0%
0%
108%
34%
63%
29%
9.7%
10%
0%
109%
2
100 g
300 g
1 small (1-1/2" dia) - 14g 1 oz - 28.35g 1 biscuit (2-1/2" dia) - 60g 1 biscuit (4" dia) - 101g
Vitamin C
Vit. C
Vitamin D
Vit. D
Vitamin A
Vit. A
Vitamin E
Vit. E
Vitamin B1
Vit. B1
Vitamin B2
Vit. B2
Vitamin B3
Vit. B3
Vitamin B5
Vit. B5
Vitamin B6
Vit. B6
Vitamin B12
Vit. B12
Vitamin K
Vit. K
Folate
Folate
0.67%
0%
0%
0%
89%
72%
55%
17%
8.1%
10%
0%
46%
All nutrients comparison - raw data values
Nutrient
DV% diff.
Selenium
37.6µg
19.5µg
33%
Polyunsaturated fat
0.823g
4.163g
22%
Folate
145µg
61µg
21%
Calcium
32mg
235mg
20%
Fats
4.3g
16.3g
18%
Manganese
0.741mg
0.378mg
16%
Saturated fat
0.983g
4.324g
15%
Sodium
906mg
580mg
14%
Vitamin B2
0.147mg
0.31mg
13%
Monounsaturated fat
1.984g
6.93g
12%
Copper
0.171mg
0.082mg
10%
Carbs
71g
44.6g
9%
Phosphorus
100mg
164mg
9%
Protein
10.4g
7g
7%
Fiber
1.5g
6%
Vitamin B1
0.43mg
0.356mg
6%
Vitamin B5
0.48mg
0.285mg
4%
Zinc
0.88mg
0.54mg
3%
Vitamin B3
3.378mg
2.949mg
3%
Magnesium
25mg
18mg
2%
Calories
371kcal
353kcal
1%
Cholesterol
0mg
3mg
1%
Potassium
100mg
121mg
1%
Iron
2.97mg
2.9mg
1%
Vitamin B6
0.042mg
0.035mg
1%
Protein per 100 calories
2.8g
2g
N/A
Calories per 10 g protein
357kcal
504kcal
N/A
Weight per 100 calories
27g
28g
N/A
Unsaturated / Saturated Fat ratio
2.9
2.6
N/A
Vitamin C
0.1mg
0.2mg
0%
Net carbs
71g
43.1g
N/A
Sugar
2.18g
N/A
Vitamin B12
0.08µg
0.08µg
0%
Tryptophan
0.123mg
0.087mg
0%
Threonine
0.293mg
0.211mg
0%
Isoleucine
0.407mg
0.273mg
0%
Leucine
0.747mg
0.514mg
0%
Lysine
0.249mg
0.226mg
0%
Methionine
0.191mg
0.132mg
0%
Phenylalanine
0.517mg
0.347mg
0%
Valine
0.458mg
0.313mg
0%
Histidine
0.229mg
0.161mg
0%
Macronutrient Comparison
Macronutrient breakdown side-by-side comparison
2
10%
4%
71%
12%
3%
Protein:
10.4 g
Fats:
4.3 g
Carbs:
71 g
Water:
11.7 g
Other:
2.6 g
3
7%
16%
45%
29%
3%
Protein:
7 g
Fats:
16.3 g
Carbs:
44.6 g
Water:
28.9 g
Other:
3.2 g
Contains
more
Protein Protein
+48.6%
Contains
more
Carbs Carbs
+59.2%
Contains
more
Fats Fats
+279.1%
Contains
more
Water Water
+147%
Contains
more
Other Other
+23.1%
Fat Type Comparison
Fat type breakdown side-by-side comparison
1
26%
52%
22%
Saturated fat:
Sat. Fat
0.983 g
Monounsaturated fat:
Mono. Fat
1.984 g
Polyunsaturated fat:
Poly. Fat
0.823 g
2
28%
45%
27%
Saturated fat:
Sat. Fat
4.324 g
Monounsaturated fat:
Mono. Fat
6.93 g
Polyunsaturated fat:
Poly. Fat
4.163 g
Contains
less
Sat. Fat Saturated fat
-77.3%
Contains
more
Mono. Fat Monounsaturated fat
+249.3%
Contains
more
Poly. Fat Polyunsaturated fat
+405.8%