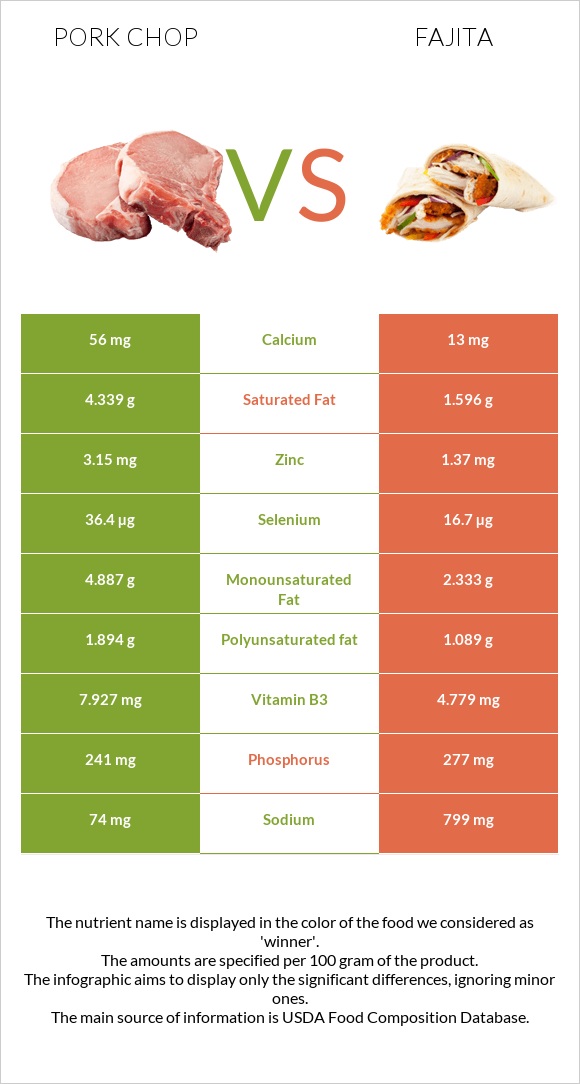
Summary of differences between pork chop and fajita The amount of selenium, vitamin B1, vitamin B3, zinc, copper, vitamin B6, vitamin B2, and vitamin B5 in pork chop is higher than in fajita. Pork chop covers your daily need for selenium, 36% more than fajita. Pork chop contains 5 times more vitamin B1 than fajita. While pork chop contains 0.49mg of vitamin B1, fajita contains only 0.1mg. The amount of saturated fat in fajita is lower. Pork chop has a lower glycemic index. The glycemic index of pork chop is 0, while the glycemic index of fajita is 42. These are the specific foods used in this comparison Pork, fresh, loin, blade (chops), bone-in, separable lean, and fat, cooked, broiled and USDA Commodity, chicken fajita strips, frozen .
Infographic
Mineral Comparison
Mineral comparison score is based on the number of minerals by which one or the other food is richer. The "coverage" charts below show how much of the daily needs can be covered by 300 grams of the food.
5
100 g
300 g
3 oz - 85g 1 chop - 219g
Magnesium
Magnesium
Calcium
Calcium
Potassium
Potassium
Iron
Iron
Copper
Copper
Zinc
Zinc
Phosphorus
Phosphorus
Sodium
Sodium
Manganese
Manganese
Selenium
Selenium
14%
17%
28%
33%
35%
86%
103%
9.7%
1.3%
199%
3
100 g
300 g
1 strip - 9.4g
Magnesium
Magnesium
Calcium
Calcium
Potassium
Potassium
Iron
Iron
Copper
Copper
Zinc
Zinc
Phosphorus
Phosphorus
Sodium
Sodium
Manganese
Manganese
Selenium
Selenium
16%
3.9%
25%
37%
10%
37%
119%
104%
8.6%
91%
Vitamin Comparison
Vitamin comparison score is based on the number of vitamins by which one or the other food is richer. The "coverage" charts below show how much of the daily needs can be covered by 300 grams of the food.
8
100 g
300 g
3 oz - 85g 1 chop - 219g
Vitamin C
Vit. C
Vitamin D
Vit. D
Vitamin A
Vit. A
Vitamin E
Vit. E
Vitamin B1
Vit. B1
Vitamin B2
Vit. B2
Vitamin B3
Vit. B3
Vitamin B5
Vit. B5
Vitamin B6
Vit. B6
Vitamin B12
Vit. B12
Vitamin K
Vit. K
Folate
Folate
0%
15%
1.3%
4.2%
123%
72%
149%
66%
113%
83%
0%
0%
2
100 g
300 g
1 strip - 9.4g
Vitamin C
Vit. C
Vitamin D
Vit. D
Vitamin A
Vit. A
Vitamin E
Vit. E
Vitamin B1
Vit. B1
Vitamin B2
Vit. B2
Vitamin B3
Vit. B3
Vitamin B5
Vit. B5
Vitamin B6
Vit. B6
Vitamin B12
Vit. B12
Vitamin K
Vit. K
Folate
Folate
0%
0%
0%
4.4%
25%
49%
90%
44%
89%
68%
0.5%
3%
All nutrients comparison - raw data values
Nutrient
DV% diff.
Selenium
36.4µg
16.7µg
36%
Vitamin B1
0.49mg
0.1mg
33%
Sodium
74mg
799mg
32%
Vitamin B3
7.927mg
4.779mg
20%
Zinc
3.15mg
1.37mg
16%
Fats
14.35g
5.73g
13%
Saturated fat
4.339g
1.596g
12%
Protein
23.72g
18.56g
10%
Copper
0.105mg
0.03mg
8%
Vitamin B2
0.313mg
0.213mg
8%
Vitamin B5
1.104mg
0.726mg
8%
Vitamin B6
0.489mg
0.387mg
8%
Monounsaturated fat
4.887g
2.333g
6%
Calories
231kcal
135kcal
5%
Vitamin D*
40 IU
5%
Vitamin D
1µg
5%
Phosphorus
241mg
277mg
5%
Vitamin B12
0.66µg
0.54µg
5%
Polyunsaturated fat
1.894g
1.089g
5%
Calcium
56mg
13mg
4%
Cholesterol
78mg
88mg
3%
Iron
0.87mg
0.99mg
2%
Manganese
0.01mg
0.066mg
2%
Carbs
0g
2.23g
1%
Potassium
315mg
284mg
1%
Folate
0µg
4µg
1%
Protein per 100 calories
10g
14g
N/A
Calories per 10 g protein
97kcal
73kcal
N/A
Weight per 100 calories
43g
74g
N/A
Unsaturated / Saturated Fat ratio
1.6
2.1
N/A
Net carbs
0g
2.23g
N/A
Magnesium
20mg
22mg
0%
Vitamin A
4µg
0µg
0%
Vitamin E
0.21mg
0.22mg
0%
Vitamin K
0µg
0.2µg
0%
Trans fat
0.066g
N/A
Choline
67.5mg
67.8mg
0%
Tryptophan
0.282mg
0.2mg
0%
Threonine
1.043mg
0.452mg
0%
Isoleucine
1.123mg
0.813mg
0%
Leucine
1.952mg
1.56mg
0%
Lysine
2.109mg
1.857mg
0%
Methionine
0.65mg
0.552mg
0%
Phenylalanine
0.985mg
0.763mg
0%
Valine
1.2mg
0.847mg
0%
Histidine
0.965mg
0.68mg
0%
Omega-3 - DHA
0.001g
0g
N/A
Omega-3 - ALA
0.065g
N/A
Omega-3 - DPA
0.011g
0.007g
N/A
Omega-6 - Gamma-linoleic acid
0.003g
N/A
Omega-6 - Eicosadienoic acid
0.065g
0.01g
N/A
Omega-6 - Linoleic acid
0.922g
N/A
Macronutrient Comparison
Macronutrient breakdown side-by-side comparison
2
24%
14%
61%
Protein:
23.72 g
Fats:
14.35 g
Carbs:
0 g
Water:
61.45 g
Other:
0.48 g
3
19%
6%
2%
71%
3%
Protein:
18.56 g
Fats:
5.73 g
Carbs:
2.23 g
Water:
70.6 g
Other:
2.88 g
Contains
more
Protein Protein
+27.8%
Contains
more
Fats Fats
+150.4%
Contains
more
Carbs Carbs
+∞%
Contains
more
Water Water
+14.9%
Contains
more
Other Other
+500%
Fat Type Comparison
Fat type breakdown side-by-side comparison
2
39%
44%
17%
Saturated fat:
Sat. Fat
4.339 g
Monounsaturated fat:
Mono. Fat
4.887 g
Polyunsaturated fat:
Poly. Fat
1.894 g
1
32%
46%
22%
Saturated fat:
Sat. Fat
1.596 g
Monounsaturated fat:
Mono. Fat
2.333 g
Polyunsaturated fat:
Poly. Fat
1.089 g
Contains
more
Mono. Fat Monounsaturated fat
+109.5%
Contains
more
Poly. Fat Polyunsaturated fat
+73.9%
Contains
less
Sat. Fat Saturated fat
-63.2%