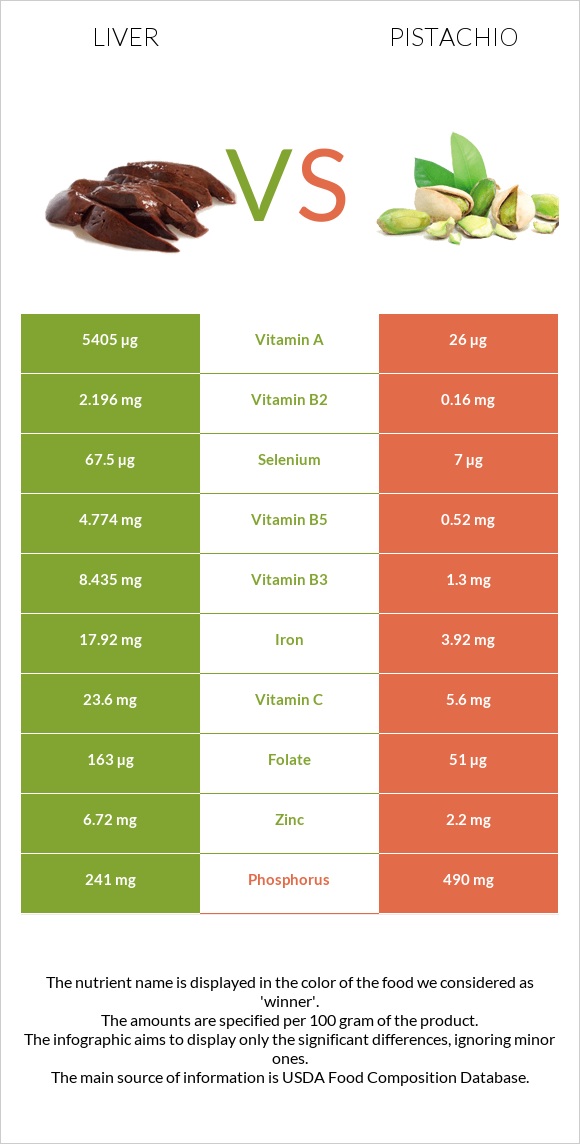
Important differences between liver and pistachios Liver has more vitamin B12, vitamin A, iron, vitamin B2, selenium, and vitamin B5; however, pistachios are richer in vitamin B6, copper, and vitamin B1. Liver's daily need coverage for vitamin B12 is 778% more. Pistachios have a higher glycemic index. The glycemic index of pistachios is 28, while the glycemic index of liver is 0. The food varieties used in the comparison are Pork, fresh, variety meats, and by-products, liver, cooked, braised and Nuts, pistachio nuts, raw .
Infographic
Mineral Comparison
Mineral comparison score is based on the number of minerals by which one or the other food is richer. The "coverage" charts below show how much of the daily needs can be covered by 300 grams of the food.
3
100 g
300 g
3 oz - 85g
Magnesium
Magnesium
Calcium
Calcium
Potassium
Potassium
Iron
Iron
Copper
Copper
Zinc
Zinc
Phosphorus
Phosphorus
Sodium
Sodium
Manganese
Manganese
Selenium
Selenium
10%
3%
13%
672%
211%
183%
103%
6.4%
39%
368%
7
100 g
300 g
1 kernel - 0.7g 1 oz (49 kernels) - 28.35g 1 cup - 123g
Magnesium
Magnesium
Calcium
Calcium
Potassium
Potassium
Iron
Iron
Copper
Copper
Zinc
Zinc
Phosphorus
Phosphorus
Sodium
Sodium
Manganese
Manganese
Selenium
Selenium
86%
32%
90%
147%
433%
60%
210%
0.13%
157%
38%
Vitamin Comparison
Vitamin comparison score is based on the number of vitamins by which one or the other food is richer. The "coverage" charts below show how much of the daily needs can be covered by 300 grams of the food.
7
100 g
300 g
3 oz - 85g
Vitamin C
Vit. C
Vitamin D
Vit. D
Vitamin A
Vit. A
Vitamin E
Vit. E
Vitamin B1
Vit. B1
Vitamin B2
Vit. B2
Vitamin B3
Vit. B3
Vitamin B5
Vit. B5
Vitamin B6
Vit. B6
Vitamin B12
Vit. B12
Vitamin K
Vit. K
Folate
Folate
79%
0%
1802%
0%
65%
507%
158%
286%
132%
2334%
0%
122%
3
100 g
300 g
1 kernel - 0.7g 1 oz (49 kernels) - 28.35g 1 cup - 123g
Vitamin C
Vit. C
Vitamin D
Vit. D
Vitamin A
Vit. A
Vitamin E
Vit. E
Vitamin B1
Vit. B1
Vitamin B2
Vit. B2
Vitamin B3
Vit. B3
Vitamin B5
Vit. B5
Vitamin B6
Vit. B6
Vitamin B12
Vit. B12
Vitamin K
Vit. K
Folate
Folate
19%
0%
8.7%
57%
218%
37%
24%
31%
392%
0%
0%
38%
All nutrients comparison - raw data values
Nutrient
DV% diff.
Vitamin B12
18.67µg
0µg
778%
Vitamin A
5405µg
26µg
598%
Iron
17.92mg
3.92mg
175%
Vitamin B2
2.196mg
0.16mg
157%
Cholesterol
355mg
0mg
118%
Selenium
67.5µg
7µg
110%
Polyunsaturated fat
1.05g
14.38g
89%
Vitamin B6
0.57mg
1.7mg
87%
Vitamin B5
4.774mg
0.52mg
85%
Copper
0.634mg
1.3mg
74%
Fats
4.4g
45.32g
63%
Monounsaturated fat
0.63g
23.257g
57%
Vitamin B1
0.258mg
0.87mg
51%
Vitamin B3
8.435mg
1.3mg
45%
Fiber
0g
10.6g
42%
Zinc
6.72mg
2.2mg
41%
Manganese
0.3mg
1.2mg
39%
Phosphorus
241mg
490mg
36%
Folate
163µg
51µg
28%
Potassium
150mg
1025mg
26%
Magnesium
14mg
121mg
25%
Calories
165kcal
560kcal
20%
Vitamin C
23.6mg
5.6mg
20%
Saturated fat
1.41g
5.907g
20%
Vitamin E
2.86mg
19%
Protein
26.02g
20.16g
12%
Calcium
10mg
105mg
10%
Carbs
3.76g
27.17g
8%
Sodium
49mg
1mg
2%
Starch
1.67g
1%
Protein per 100 calories
16g
3.6g
N/A
Calories per 10 g protein
63kcal
278kcal
N/A
Weight per 100 calories
61g
18g
N/A
Unsaturated / Saturated Fat ratio
1.2
6.4
N/A
Net carbs
3.76g
16.57g
N/A
Sugar
7.66g
N/A
Tryptophan
0.366mg
0.251mg
0%
Threonine
1.107mg
0.684mg
0%
Isoleucine
1.32mg
0.917mg
0%
Leucine
2.319mg
1.604mg
0%
Lysine
2.007mg
1.138mg
0%
Methionine
0.645mg
0.36mg
0%
Phenylalanine
1.274mg
1.092mg
0%
Valine
1.607mg
1.249mg
0%
Histidine
0.708mg
0.512mg
0%
Fructose
0.24g
0%
Omega-3 - DHA
0.03g
0g
N/A
Omega-3 - DPA
0.04g
0g
N/A
Omega-6 - Linoleic acid
14.091g
N/A
Macronutrient Comparison
Macronutrient breakdown side-by-side comparison
2
26%
4%
4%
64%
Protein:
26.02 g
Fats:
4.4 g
Carbs:
3.76 g
Water:
64.32 g
Other:
1.5 g
3
20%
45%
27%
4%
3%
Protein:
20.16 g
Fats:
45.32 g
Carbs:
27.17 g
Water:
4.37 g
Other:
2.98 g
Contains
more
Protein Protein
+29.1%
Contains
more
Water Water
+1371.9%
Contains
more
Fats Fats
+930%
Contains
more
Carbs Carbs
+622.6%
Contains
more
Other Other
+98.7%
Fat Type Comparison
Fat type breakdown side-by-side comparison
1
46%
20%
34%
Saturated fat:
Sat. Fat
1.41 g
Monounsaturated fat:
Mono. Fat
0.63 g
Polyunsaturated fat:
Poly. Fat
1.05 g
2
14%
53%
33%
Saturated fat:
Sat. Fat
5.907 g
Monounsaturated fat:
Mono. Fat
23.257 g
Polyunsaturated fat:
Poly. Fat
14.38 g
Contains
less
Sat. Fat Saturated fat
-76.1%
Contains
more
Mono. Fat Monounsaturated fat
+3591.6%
Contains
more
Poly. Fat Polyunsaturated fat
+1269.5%