Differences between liver and cinnamon Liver is higher in vitamin B12, vitamin A, vitamin B2, iron, selenium, and vitamin B5; however, cinnamon is richer in manganese, fiber, and calcium. Liver's daily need coverage for vitamin B12 is 778% higher. The food types used in this comparison are Pork, fresh, variety meats, and by-products, liver, cooked, braised and Spices, cinnamon, ground .
Infographic
Mineral Comparison
Mineral comparison score is based on the number of minerals by which one or the other food is richer. The "coverage" charts below show how much of the daily needs can be covered by 300 grams of the food.
5
100 g
300 g
3 oz - 85g
Magnesium
Magnesium
Calcium
Calcium
Potassium
Potassium
Iron
Iron
Copper
Copper
Zinc
Zinc
Phosphorus
Phosphorus
Sodium
Sodium
Manganese
Manganese
Selenium
Selenium
10%
3%
13%
672%
211%
183%
103%
6.4%
39%
368%
5
100 g
300 g
0.25 tsp - 0.5g 1 tbsp - 7.8g
Magnesium
Magnesium
Calcium
Calcium
Potassium
Potassium
Iron
Iron
Copper
Copper
Zinc
Zinc
Phosphorus
Phosphorus
Sodium
Sodium
Manganese
Manganese
Selenium
Selenium
43%
301%
38%
312%
113%
50%
27%
1.3%
2278%
17%
Vitamin Comparison
Vitamin comparison score is based on the number of vitamins by which one or the other food is richer. The "coverage" charts below show how much of the daily needs can be covered by 300 grams of the food.
9
100 g
300 g
3 oz - 85g
Vitamin C
Vit. C
Vitamin D
Vit. D
Vitamin A
Vit. A
Vitamin E
Vit. E
Vitamin B1
Vit. B1
Vitamin B2
Vit. B2
Vitamin B3
Vit. B3
Vitamin B5
Vit. B5
Vitamin B6
Vit. B6
Vitamin B12
Vit. B12
Vitamin K
Vit. K
Folate
Folate
79%
0%
1802%
0%
65%
507%
158%
286%
132%
2334%
0%
122%
2
100 g
300 g
0.25 tsp - 0.5g 1 tbsp - 7.8g
Vitamin C
Vit. C
Vitamin D
Vit. D
Vitamin A
Vit. A
Vitamin E
Vit. E
Vitamin B1
Vit. B1
Vitamin B2
Vit. B2
Vitamin B3
Vit. B3
Vitamin B5
Vit. B5
Vitamin B6
Vit. B6
Vitamin B12
Vit. B12
Vitamin K
Vit. K
Folate
Folate
13%
0%
5%
46%
5.5%
9.5%
25%
21%
36%
0%
78%
4.5%
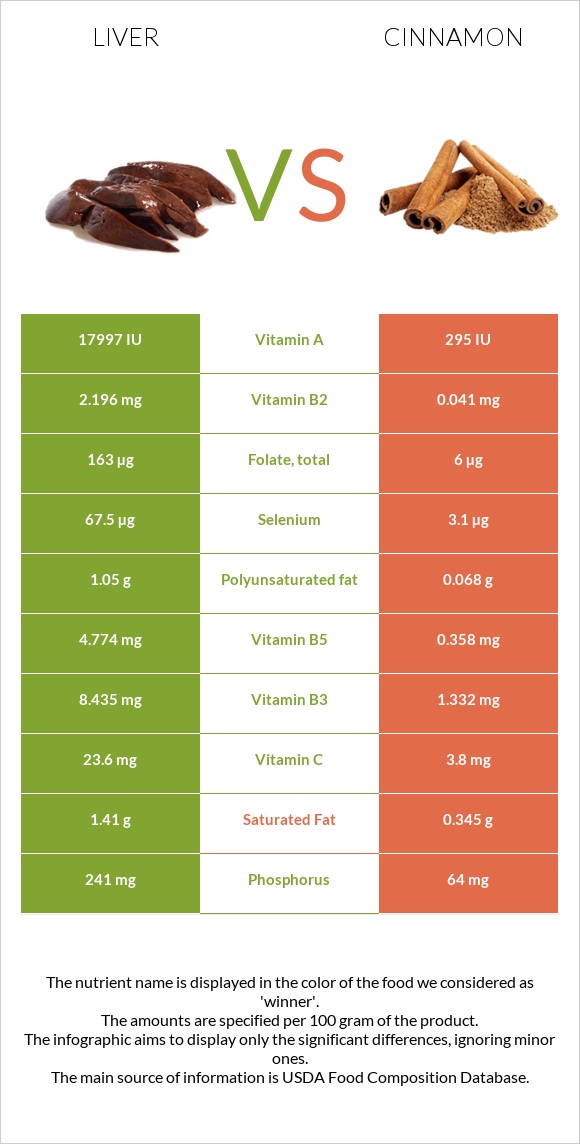
All nutrients comparison - raw data values
Nutrient
DV% diff.
Vitamin B12
18.67µg
0µg
778%
Manganese
0.3mg
17.466mg
746%
Vitamin A
5405µg
15µg
599%
Fiber
0g
53.1g
212%
Vitamin B2
2.196mg
0.041mg
166%
Iron
17.92mg
8.32mg
120%
Cholesterol
355mg
0mg
118%
Selenium
67.5µg
3.1µg
117%
Calcium
10mg
1002mg
99%
Vitamin B5
4.774mg
0.358mg
88%
Protein
26.02g
3.99g
44%
Zinc
6.72mg
1.83mg
44%
Vitamin B3
8.435mg
1.332mg
44%
Folate
163µg
6µg
39%
Copper
0.634mg
0.339mg
33%
Vitamin B6
0.57mg
0.158mg
32%
Carbs
3.76g
80.59g
26%
Vitamin K
31.2µg
26%
Phosphorus
241mg
64mg
25%
Vitamin C
23.6mg
3.8mg
22%
Vitamin B1
0.258mg
0.022mg
20%
Vitamin E
2.32mg
15%
Magnesium
14mg
60mg
11%
Potassium
150mg
431mg
8%
Polyunsaturated fat
1.05g
0.068g
7%
Fats
4.4g
1.24g
5%
Saturated fat
1.41g
0.345g
5%
Calories
165kcal
247kcal
4%
Sodium
49mg
10mg
2%
Choline
11mg
2%
Monounsaturated fat
0.63g
0.246g
1%
Fructose
1.11g
1%
Protein per 100 calories
16g
1.6g
N/A
Calories per 10 g protein
63kcal
619kcal
N/A
Weight per 100 calories
61g
40g
N/A
Unsaturated / Saturated Fat ratio
1.2
0.91
N/A
Net carbs
3.76g
27.49g
N/A
Sugar
2.17g
N/A
Tryptophan
0.366mg
0.049mg
0%
Threonine
1.107mg
0.136mg
0%
Isoleucine
1.32mg
0.146mg
0%
Leucine
2.319mg
0.253mg
0%
Lysine
2.007mg
0.243mg
0%
Methionine
0.645mg
0.078mg
0%
Phenylalanine
1.274mg
0.146mg
0%
Valine
1.607mg
0.224mg
0%
Histidine
0.708mg
0.117mg
0%
Omega-3 - DHA
0.03g
0g
N/A
Omega-3 - ALA
0.011g
N/A
Omega-3 - DPA
0.04g
0g
N/A
Macronutrient Comparison
Macronutrient breakdown side-by-side comparison
3
26%
4%
4%
64%
Protein:
26.02 g
Fats:
4.4 g
Carbs:
3.76 g
Water:
64.32 g
Other:
1.5 g
2
4%
81%
11%
4%
Protein:
3.99 g
Fats:
1.24 g
Carbs:
80.59 g
Water:
10.58 g
Other:
3.6 g
Contains
more
Protein Protein
+552.1%
Contains
more
Fats Fats
+254.8%
Contains
more
Water Water
+507.9%
Contains
more
Carbs Carbs
+2043.4%
Contains
more
Other Other
+140%
Fat Type Comparison
Fat type breakdown side-by-side comparison
2
46%
20%
34%
Saturated fat:
Sat. Fat
1.41 g
Monounsaturated fat:
Mono. Fat
0.63 g
Polyunsaturated fat:
Poly. Fat
1.05 g
1
52%
37%
10%
Saturated fat:
Sat. Fat
0.345 g
Monounsaturated fat:
Mono. Fat
0.246 g
Polyunsaturated fat:
Poly. Fat
0.068 g
Contains
more
Mono. Fat Monounsaturated fat
+156.1%
Contains
more
Poly. Fat Polyunsaturated fat
+1444.1%
Contains
less
Sat. Fat Saturated fat
-75.5%