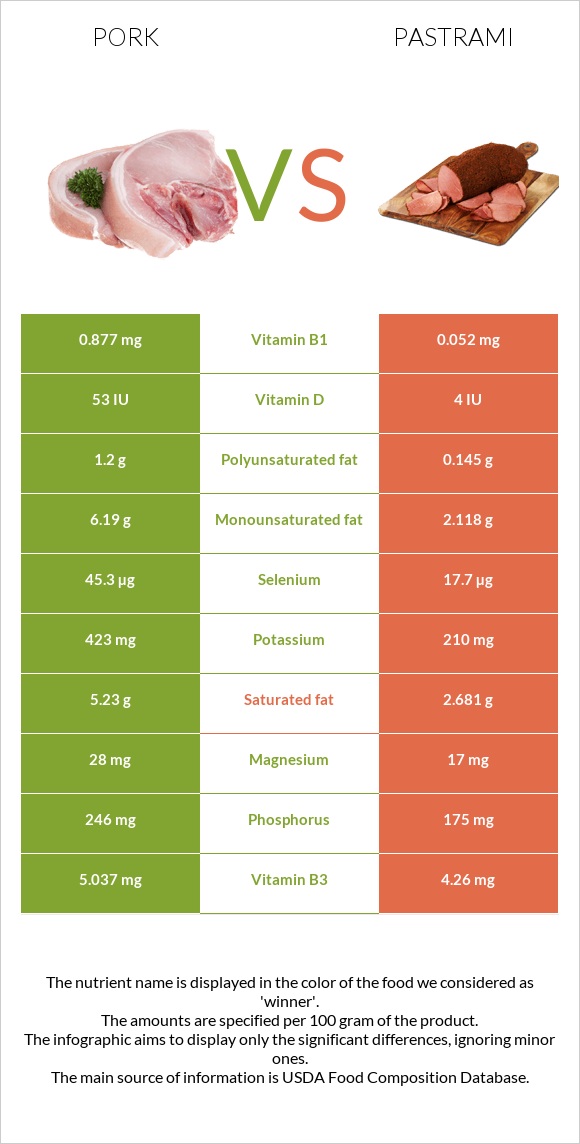
What are the differences between pork and pastrami? Pork is higher in vitamin B1, selenium, vitamin B6, vitamin B2, and phosphorus, yet pastrami is higher in vitamin B12, zinc, and iron. Pork's daily need coverage for vitamin B1 is 69% more. Pork has 3 times more selenium than pastrami. While pork has 45.3µg of selenium, pastrami has only 17.7µg. The amount of saturated fat in pastrami is lower. The glycemic index of pork is lower. We used Pork, fresh, loin, whole, separable lean, and fat, cooked, broiled and Beef, cured, pastrami types in this article.
Infographic
Mineral Comparison
Mineral comparison score is based on the number of minerals by which one or the other food is richer. The "coverage" charts below show how much of the daily needs can be covered by 300 grams of the food.
6
100 g
300 g
3 oz - 85g 1 chop, excluding refuse (yield from 1 raw chop, with refuse, weighing 151 g) - 87g
Magnesium
Magnesium
Calcium
Calcium
Potassium
Potassium
Iron
Iron
Copper
Copper
Zinc
Zinc
Phosphorus
Phosphorus
Sodium
Sodium
Manganese
Manganese
Selenium
Selenium
20%
5.7%
37%
33%
24%
65%
105%
8.1%
1.2%
247%
4
100 g
300 g
1 slice (1 oz) - 28g 1 package, 2.5 oz - 71g
Magnesium
Magnesium
Calcium
Calcium
Potassium
Potassium
Iron
Iron
Copper
Copper
Zinc
Zinc
Phosphorus
Phosphorus
Sodium
Sodium
Manganese
Manganese
Selenium
Selenium
12%
3%
19%
83%
30%
136%
75%
141%
3.5%
97%
Vitamin Comparison
Vitamin comparison score is based on the number of vitamins by which one or the other food is richer. The "coverage" charts below show how much of the daily needs can be covered by 300 grams of the food.
8
100 g
300 g
3 oz - 85g 1 chop, excluding refuse (yield from 1 raw chop, with refuse, weighing 151 g) - 87g
Vitamin C
Vit. C
Vitamin D
Vit. D
Vitamin A
Vit. A
Vitamin E
Vit. E
Vitamin B1
Vit. B1
Vitamin B2
Vit. B2
Vitamin B3
Vit. B3
Vitamin B5
Vit. B5
Vitamin B6
Vit. B6
Vitamin B12
Vit. B12
Vitamin K
Vit. K
Folate
Folate
2%
20%
0.67%
5.8%
219%
74%
94%
42%
107%
88%
0%
3.8%
3
100 g
300 g
1 slice (1 oz) - 28g 1 package, 2.5 oz - 71g
Vitamin C
Vit. C
Vitamin D
Vit. D
Vitamin A
Vit. A
Vitamin E
Vit. E
Vitamin B1
Vit. B1
Vitamin B2
Vit. B2
Vitamin B3
Vit. B3
Vitamin B5
Vit. B5
Vitamin B6
Vit. B6
Vitamin B12
Vit. B12
Vitamin K
Vit. K
Folate
Folate
1%
1.5%
0.67%
2.4%
13%
37%
80%
16%
51%
234%
1.8%
4.5%
All nutrients comparison - raw data values
Nutrient
DV% diff.
Vitamin B1
0.877mg
0.052mg
69%
Selenium
45.3µg
17.7µg
50%
Vitamin B12
0.7µg
1.87µg
49%
Sodium
62mg
1078mg
44%
Zinc
2.39mg
4.98mg
24%
Vitamin B6
0.464mg
0.221mg
19%
Iron
0.87mg
2.22mg
17%
Fats
13.92g
5.82g
12%
Vitamin B2
0.321mg
0.161mg
12%
Saturated fat
5.23g
2.681g
12%
Protein
27.32g
21.8g
11%
Phosphorus
246mg
175mg
10%
Monounsaturated fat
6.19g
2.118g
10%
Vitamin B5
0.698mg
0.265mg
9%
Polyunsaturated fat
1.2g
0.145g
7%
Vitamin D*
53 IU
4 IU
6%
Vitamin D
1.3µg
0.1µg
6%
Potassium
423mg
210mg
6%
Calories
242kcal
147kcal
5%
Vitamin B3
5.037mg
4.26mg
5%
Cholesterol
80mg
68mg
4%
Magnesium
28mg
17mg
3%
Copper
0.073mg
0.091mg
2%
Choline
93.9mg
81.6mg
2%
Calcium
19mg
10mg
1%
Vitamin E
0.29mg
0.12mg
1%
Manganese
0.009mg
0.027mg
1%
Vitamin K
0µg
0.7µg
1%
Protein per 100 calories
11g
15g
N/A
Calories per 10 g protein
89kcal
67kcal
N/A
Weight per 100 calories
41g
68g
N/A
Unsaturated / Saturated Fat ratio
1.4
0.84
N/A
Vitamin C
0.6mg
0.3mg
0%
Net carbs
0g
0.36g
N/A
Carbs
0g
0.36g
0%
Sugar
0g
0.1g
N/A
Vitamin A
2µg
2µg
0%
Folate
5µg
6µg
0%
Tryptophan
0.338mg
0.141mg
0%
Threonine
1.234mg
0.857mg
0%
Isoleucine
1.26mg
0.976mg
0%
Leucine
2.177mg
1.706mg
0%
Lysine
2.446mg
1.812mg
0%
Methionine
0.712mg
0.558mg
0%
Phenylalanine
1.086mg
0.847mg
0%
Valine
1.473mg
1.065mg
0%
Histidine
1.067mg
0.684mg
0%
Fructose
0.01g
0%
Macronutrient Comparison
Macronutrient breakdown side-by-side comparison
2
27%
14%
58%
Protein:
27.32 g
Fats:
13.92 g
Carbs:
0 g
Water:
57.87 g
Other:
0.89 g
3
22%
6%
70%
2%
Protein:
21.8 g
Fats:
5.82 g
Carbs:
0.36 g
Water:
69.53 g
Other:
2.49 g
Contains
more
Protein Protein
+25.3%
Contains
more
Fats Fats
+139.2%
Contains
more
Carbs Carbs
+∞%
Contains
more
Water Water
+20.1%
Contains
more
Other Other
+179.8%
Fat Type Comparison
Fat type breakdown side-by-side comparison
2
41%
49%
10%
Saturated fat:
Sat. Fat
5.23 g
Monounsaturated fat:
Mono. Fat
6.19 g
Polyunsaturated fat:
Poly. Fat
1.2 g
1
54%
43%
3%
Saturated fat:
Sat. Fat
2.681 g
Monounsaturated fat:
Mono. Fat
2.118 g
Polyunsaturated fat:
Poly. Fat
0.145 g
Contains
more
Mono. Fat Monounsaturated fat
+192.3%
Contains
more
Poly. Fat Polyunsaturated fat
+727.6%
Contains
less
Sat. Fat Saturated fat
-48.7%