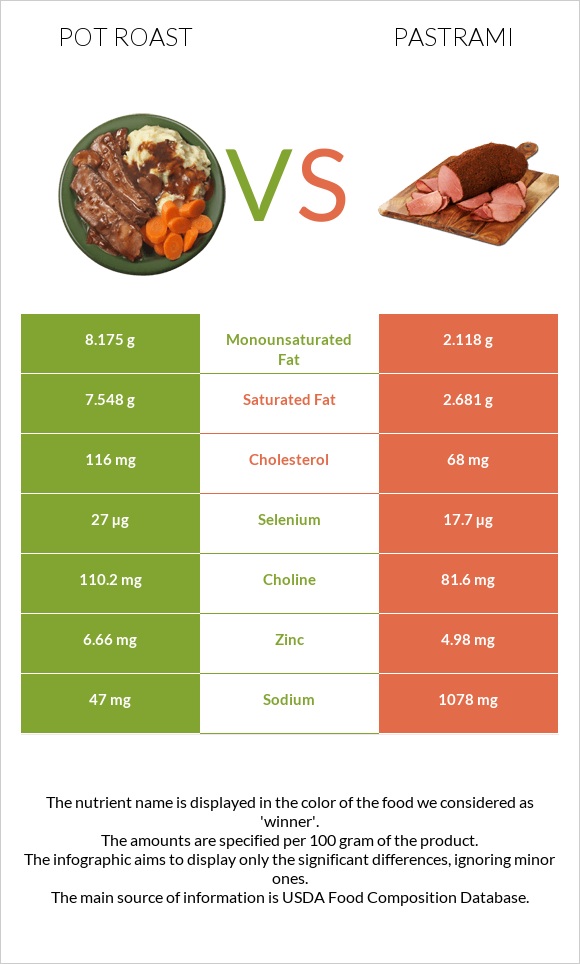
How are pot roast and pastrami different? Pot roast is higher than pastrami in selenium, zinc, vitamin B12, vitamin B5, choline, and monounsaturated fat. Pastrami covers your daily need for sodium, 45% more than pot roast. Pot roast contains 4 times more monounsaturated fat than pastrami. Pot roast contains 8.175g of monounsaturated fat, while pastrami contains 2.118g. Pastrami is lower in saturated fat. Pastrami has a higher glycemic index (70) than pot roast (0). Beef, chuck, arm pot roast, separable lean, and fat, trimmed to 0" fat, all grades, cooked, braised and Beef, cured, pastrami types were used in this article.
Infographic
Mineral Comparison
Mineral comparison score is based on the number of minerals by which one or the other food is richer. The "coverage" charts below show how much of the daily needs can be covered by 300 grams of the food.
5
100 g
300 g
3 oz - 85g 1 roast (yield from 1601 g raw meat) - 1166g
Magnesium
Magnesium
Calcium
Calcium
Potassium
Potassium
Iron
Iron
Copper
Copper
Zinc
Zinc
Phosphorus
Phosphorus
Sodium
Sodium
Manganese
Manganese
Selenium
Selenium
14%
4.8%
20%
91%
33%
182%
75%
6.1%
1.3%
147%
1
100 g
300 g
1 slice (1 oz) - 28g 1 package, 2.5 oz - 71g
Magnesium
Magnesium
Calcium
Calcium
Potassium
Potassium
Iron
Iron
Copper
Copper
Zinc
Zinc
Phosphorus
Phosphorus
Sodium
Sodium
Manganese
Manganese
Selenium
Selenium
12%
3%
19%
83%
30%
136%
75%
141%
3.5%
97%
Vitamin Comparison
Vitamin comparison score is based on the number of vitamins by which one or the other food is richer. The "coverage" charts below show how much of the daily needs can be covered by 300 grams of the food.
8
100 g
300 g
3 oz - 85g 1 roast (yield from 1601 g raw meat) - 1166g
Vitamin C
Vit. C
Vitamin D
Vit. D
Vitamin A
Vit. A
Vitamin E
Vit. E
Vitamin B1
Vit. B1
Vitamin B2
Vit. B2
Vitamin B3
Vit. B3
Vitamin B5
Vit. B5
Vitamin B6
Vit. B6
Vitamin B12
Vit. B12
Vitamin K
Vit. K
Folate
Folate
0%
3%
0%
10%
15%
39%
77%
34%
65%
266%
4.5%
6.8%
2
100 g
300 g
1 slice (1 oz) - 28g 1 package, 2.5 oz - 71g
Vitamin C
Vit. C
Vitamin D
Vit. D
Vitamin A
Vit. A
Vitamin E
Vit. E
Vitamin B1
Vit. B1
Vitamin B2
Vit. B2
Vitamin B3
Vit. B3
Vitamin B5
Vit. B5
Vitamin B6
Vit. B6
Vitamin B12
Vit. B12
Vitamin K
Vit. K
Folate
Folate
1%
1.5%
0.67%
2.4%
13%
37%
80%
16%
51%
234%
1.8%
4.5%
All nutrients comparison - raw data values
Nutrient
DV% diff.
Sodium
47mg
1078mg
45%
Saturated fat
7.548g
2.681g
22%
Fats
19.17g
5.82g
21%
Selenium
27µg
17.7µg
17%
Cholesterol
116mg
68mg
16%
Zinc
6.66mg
4.98mg
15%
Monounsaturated fat
8.175g
2.118g
15%
Protein
28.94g
21.8g
14%
Vitamin B12
2.13µg
1.87µg
11%
Calories
297kcal
147kcal
8%
Vitamin B5
0.571mg
0.265mg
6%
Vitamin B6
0.283mg
0.221mg
5%
Choline
110.2mg
81.6mg
5%
Polyunsaturated fat
0.708g
0.145g
4%
Iron
2.42mg
2.22mg
3%
Vitamin E
0.51mg
0.12mg
3%
Vitamin D*
8 IU
4 IU
1%
Vitamin D
0.2µg
0.1µg
1%
Calcium
16mg
10mg
1%
Potassium
231mg
210mg
1%
Copper
0.099mg
0.091mg
1%
Manganese
0.01mg
0.027mg
1%
Vitamin B1
0.059mg
0.052mg
1%
Vitamin B2
0.171mg
0.161mg
1%
Vitamin B3
4.105mg
4.26mg
1%
Vitamin K
1.8µg
0.7µg
1%
Folate
9µg
6µg
1%
Protein per 100 calories
9.7g
15g
N/A
Calories per 10 g protein
103kcal
67kcal
N/A
Weight per 100 calories
34g
68g
N/A
Unsaturated / Saturated Fat ratio
1.2
0.84
N/A
Vitamin C
0mg
0.3mg
0%
Net carbs
0g
0.36g
N/A
Carbs
0g
0.36g
0%
Magnesium
19mg
17mg
0%
Sugar
0g
0.1g
N/A
Phosphorus
174mg
175mg
0%
Vitamin A
0µg
2µg
0%
Tryptophan
0.19mg
0.141mg
0%
Threonine
1.156mg
0.857mg
0%
Isoleucine
1.317mg
0.976mg
0%
Leucine
2.302mg
1.706mg
0%
Lysine
2.446mg
1.812mg
0%
Methionine
0.754mg
0.558mg
0%
Phenylalanine
1.143mg
0.847mg
0%
Valine
1.436mg
1.065mg
0%
Histidine
0.924mg
0.684mg
0%
Fructose
0.01g
0%
Macronutrient Comparison
Macronutrient breakdown side-by-side comparison
2
29%
19%
52%
Protein:
28.94 g
Fats:
19.17 g
Carbs:
0 g
Water:
51.9 g
Other:
0 g
3
22%
6%
70%
2%
Protein:
21.8 g
Fats:
5.82 g
Carbs:
0.36 g
Water:
69.53 g
Other:
2.49 g
Contains
more
Protein Protein
+32.8%
Contains
more
Fats Fats
+229.4%
Contains
more
Carbs Carbs
+∞%
Contains
more
Water Water
+34%
Contains
more
Other Other
+∞%
Fat Type Comparison
Fat type breakdown side-by-side comparison
2
46%
50%
4%
Saturated fat:
Sat. Fat
7.548 g
Monounsaturated fat:
Mono. Fat
8.175 g
Polyunsaturated fat:
Poly. Fat
0.708 g
1
54%
43%
3%
Saturated fat:
Sat. Fat
2.681 g
Monounsaturated fat:
Mono. Fat
2.118 g
Polyunsaturated fat:
Poly. Fat
0.145 g
Contains
more
Mono. Fat Monounsaturated fat
+286%
Contains
more
Poly. Fat Polyunsaturated fat
+388.3%
Contains
less
Sat. Fat Saturated fat
-64.5%