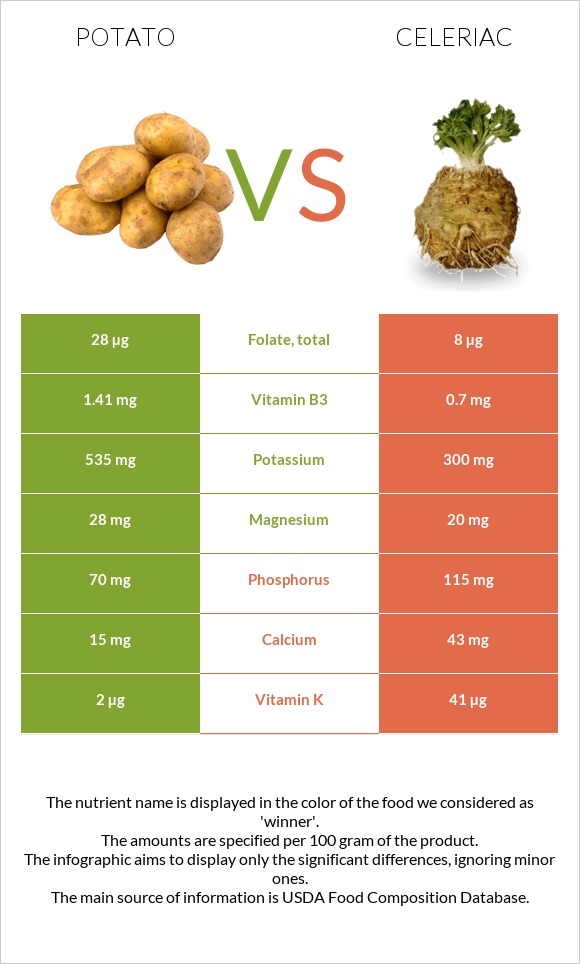
A recap on the differences between potatoes and celeriac Potatoes have more vitamin B6, potassium, and copper; however, celeriac is higher in vitamin K and phosphorus. Celeriac covers your daily vitamin K needs 33% more than potatoes. Celeriac contains 4 times less folate than potatoes. Potatoes contain 28µg of folate, while celeriac contains 8µg. The glycemic index of potatoes is higher. Food varieties used in this article are Potatoes, baked, flesh, and skin, without salt and Celeriac, raw .
Infographic
Mineral Comparison
Mineral comparison score is based on the number of minerals by which one or the other food is richer. The "coverage" charts below show how much of the daily needs can be covered by 300 grams of the food.
6
100 g
300 g
1 potato small - 138g 1 NLEA serving - 148g 1 potato medium - 173g 1 potato large - 299g
Magnesium
Magnesium
Calcium
Calcium
Potassium
Potassium
Iron
Iron
Copper
Copper
Zinc
Zinc
Phosphorus
Phosphorus
Sodium
Sodium
Manganese
Manganese
Selenium
Selenium
20%
4.5%
47%
41%
39%
9.8%
30%
1.3%
29%
2.2%
3
100 g
300 g
1 cup - 156g
Magnesium
Magnesium
Calcium
Calcium
Potassium
Potassium
Iron
Iron
Copper
Copper
Zinc
Zinc
Phosphorus
Phosphorus
Sodium
Sodium
Manganese
Manganese
Selenium
Selenium
14%
13%
26%
26%
23%
9%
49%
13%
21%
3.8%
Vitamin Comparison
Vitamin comparison score is based on the number of vitamins by which one or the other food is richer. The "coverage" charts below show how much of the daily needs can be covered by 300 grams of the food.
6
100 g
300 g
1 potato small - 138g 1 NLEA serving - 148g 1 potato medium - 173g 1 potato large - 299g
Vitamin C
Vit. C
Vitamin D
Vit. D
Vitamin A
Vit. A
Vitamin E
Vit. E
Vitamin B1
Vit. B1
Vitamin B2
Vit. B2
Vitamin B3
Vit. B3
Vitamin B5
Vit. B5
Vitamin B6
Vit. B6
Vitamin B12
Vit. B12
Vitamin K
Vit. K
Folate
Folate
32%
0%
0.33%
0.8%
16%
11%
26%
23%
72%
0%
5%
21%
3
100 g
300 g
1 cup - 156g
Vitamin C
Vit. C
Vitamin D
Vit. D
Vitamin A
Vit. A
Vitamin E
Vit. E
Vitamin B1
Vit. B1
Vitamin B2
Vit. B2
Vitamin B3
Vit. B3
Vitamin B5
Vit. B5
Vitamin B6
Vit. B6
Vitamin B12
Vit. B12
Vitamin K
Vit. K
Folate
Folate
27%
0%
0%
7.2%
13%
14%
13%
21%
38%
0%
103%
6%
All nutrients comparison - raw data values
Nutrient
DV% diff.
Vitamin K
2µg
41µg
33%
Vitamin B6
0.311mg
0.165mg
11%
Potassium
535mg
300mg
7%
Starch
17.27g
7%
Phosphorus
70mg
115mg
6%
Iron
1.08mg
0.7mg
5%
Copper
0.118mg
0.07mg
5%
Folate
28µg
8µg
5%
Carbs
21.15g
9.2g
4%
Sodium
10mg
100mg
4%
Vitamin B3
1.41mg
0.7mg
4%
Calories
93kcal
42kcal
3%
Calcium
15mg
43mg
3%
Manganese
0.219mg
0.158mg
3%
Protein
2.5g
1.5g
2%
Vitamin C
9.6mg
8mg
2%
Magnesium
28mg
20mg
2%
Fiber
2.2g
1.8g
2%
Vitamin E
0.04mg
0.36mg
2%
Selenium
0.4µg
0.7µg
1%
Vitamin B1
0.064mg
0.05mg
1%
Vitamin B2
0.048mg
0.06mg
1%
Choline
14.8mg
9mg
1%
Polyunsaturated fat
0.057g
0.148g
1%
Protein per 100 calories
2.7g
3.6g
N/A
Calories per 10 g protein
372kcal
280kcal
N/A
Weight per 100 calories
108g
238g
N/A
Fats
0.13g
0.3g
0%
Net carbs
18.95g
7.4g
N/A
Sugar
1.18g
1.6g
N/A
Zinc
0.36mg
0.33mg
0%
Vitamin A
1µg
0µg
0%
Vitamin B5
0.376mg
0.352mg
0%
Saturated fat
0.034g
0.079g
0%
Monounsaturated fat
0.003g
0.058g
0%
Tryptophan
0.025mg
0%
Threonine
0.081mg
0%
Isoleucine
0.08mg
0%
Leucine
0.119mg
0%
Lysine
0.13mg
0%
Methionine
0.038mg
0%
Phenylalanine
0.099mg
0%
Valine
0.125mg
0%
Histidine
0.042mg
0%
Fructose
0.34g
0%
Macronutrient Comparison
Macronutrient breakdown side-by-side comparison
3
3%
21%
75%
Protein:
2.5 g
Fats:
0.13 g
Carbs:
21.15 g
Water:
74.89 g
Other:
1.33 g
2
9%
88%
Protein:
1.5 g
Fats:
0.3 g
Carbs:
9.2 g
Water:
88 g
Other:
1 g
Contains
more
Protein Protein
+66.7%
Contains
more
Carbs Carbs
+129.9%
Contains
more
Other Other
+33%
Contains
more
Fats Fats
+130.8%
Contains
more
Water Water
+17.5%
Fat Type Comparison
Fat type breakdown side-by-side comparison
1
36%
3%
61%
Saturated fat:
Sat. Fat
0.034 g
Monounsaturated fat:
Mono. Fat
0.003 g
Polyunsaturated fat:
Poly. Fat
0.057 g
2
28%
20%
52%
Saturated fat:
Sat. Fat
0.079 g
Monounsaturated fat:
Mono. Fat
0.058 g
Polyunsaturated fat:
Poly. Fat
0.148 g
Contains
less
Sat. Fat Saturated fat
-57%
Contains
more
Mono. Fat Monounsaturated fat
+1833.3%
Contains
more
Poly. Fat Polyunsaturated fat
+159.6%