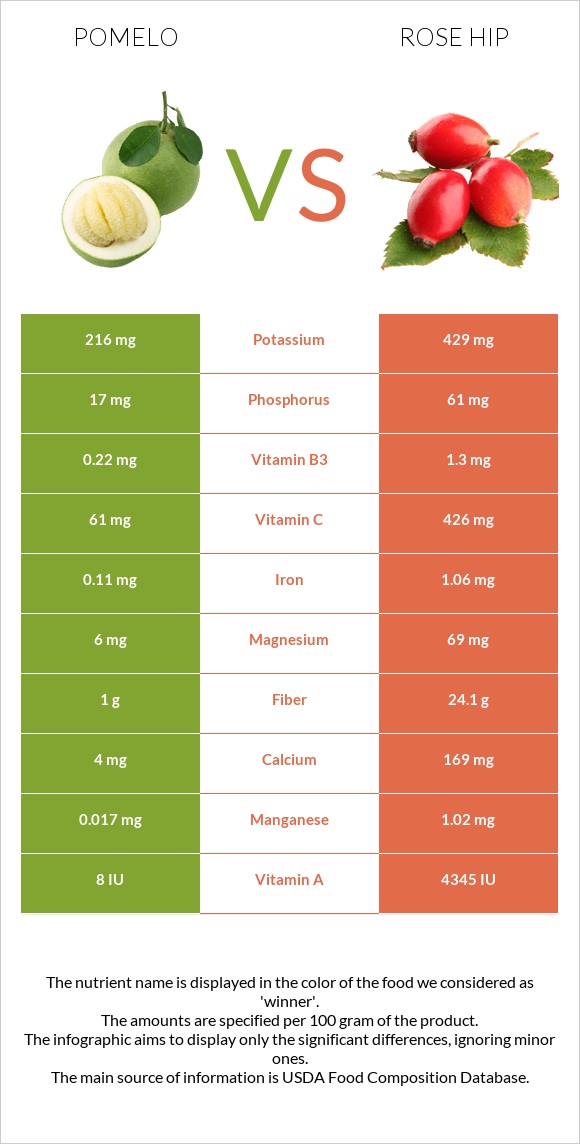
How are pomelo and rose hips different? Rose hips are higher than pomelo in vitamin C, fiber, vitamin A, manganese, calcium, magnesium, iron, vitamin B2, copper, and vitamin B3. Rose hips cover your daily need for vitamin C, 406% more than pomelo. Pomelo has a higher glycemic index (78) than rose hips (64). Pummelo, raw and Rose Hips, wild (Northern Plains Indians) types were used in this article.
Infographic
Mineral Comparison
Mineral comparison score is based on the number of minerals by which one or the other food is richer. The "coverage" charts below show how much of the daily needs can be covered by 300 grams of the food.
1
100 g
300 g
1 cup, sections - 190g 1 fruit without refuse - 609g
Magnesium
Magnesium
Calcium
Calcium
Potassium
Potassium
Iron
Iron
Copper
Copper
Zinc
Zinc
Phosphorus
Phosphorus
Sodium
Sodium
Manganese
Manganese
Selenium
Selenium
4.3%
1.2%
19%
4.1%
16%
2.2%
7.3%
0.13%
2.2%
0%
8
100 g
300 g
1 cup - 127g
Magnesium
Magnesium
Calcium
Calcium
Potassium
Potassium
Iron
Iron
Copper
Copper
Zinc
Zinc
Phosphorus
Phosphorus
Sodium
Sodium
Manganese
Manganese
Selenium
Selenium
49%
51%
38%
40%
38%
6.8%
26%
0.52%
133%
0%
Vitamin Comparison
Vitamin comparison score is based on the number of vitamins by which one or the other food is richer. The "coverage" charts below show how much of the daily needs can be covered by 300 grams of the food.
1
100 g
300 g
1 cup, sections - 190g 1 fruit without refuse - 609g
Vitamin C
Vit. C
Vitamin D
Vit. D
Vitamin A
Vit. A
Vitamin E
Vit. E
Vitamin B1
Vit. B1
Vitamin B2
Vit. B2
Vitamin B3
Vit. B3
Vitamin B5
Vit. B5
Vitamin B6
Vit. B6
Vitamin B12
Vit. B12
Vitamin K
Vit. K
Folate
Folate
203%
0%
0%
0%
8.5%
6.2%
4.1%
0%
8.3%
0%
0%
0%
9
100 g
300 g
1 cup - 127g
Vitamin C
Vit. C
Vitamin D
Vit. D
Vitamin A
Vit. A
Vitamin E
Vit. E
Vitamin B1
Vit. B1
Vitamin B2
Vit. B2
Vitamin B3
Vit. B3
Vitamin B5
Vit. B5
Vitamin B6
Vit. B6
Vitamin B12
Vit. B12
Vitamin K
Vit. K
Folate
Folate
1420%
0%
72%
117%
4%
38%
24%
48%
18%
0%
65%
2.3%
All nutrients comparison - raw data values
Macronutrient Comparison
Macronutrient breakdown side-by-side comparison
1
10%
89%
Protein:
0.76 g
Fats:
0.04 g
Carbs:
9.62 g
Water:
89.1 g
Other:
0.48 g
4
38%
59%
Protein:
1.6 g
Fats:
0.34 g
Carbs:
38.22 g
Water:
58.66 g
Other:
1.18 g
Contains
more
Water Water
+51.9%
Contains
more
Protein Protein
+110.5%
Contains
more
Fats Fats
+750%
Contains
more
Carbs Carbs
+297.3%
Contains
more
Other Other
+145.8%